In the Part 1 of AlloyDB Blog Series, I discussed the Introduction of AlloyDB for PostgresSQL. Then in Part 2 of the blog series, I discussed how to do the installation of AlloyDB Omni in a GCE VM. In Part 3 of the blog series, I discussed how to connect to AlloyDB Omni using psql and pgAdmin. In Part 4 of the blog series, I discussed how to load TPCH data into the AlloyDB Omni instance and check out AlloyDB Omni’s columnar engine. In Part 5 of the blog series, I covered topic of Compare AlloyDB Omni with PostgreSQL. In Part 6 of the blog series, I discussed how to create an AlloyDB cluster on GCP and how to connect using several different approaches, including one approach from my laptop. In Part 7 of the blog series, I will discuss more about how to use AlloyDB.
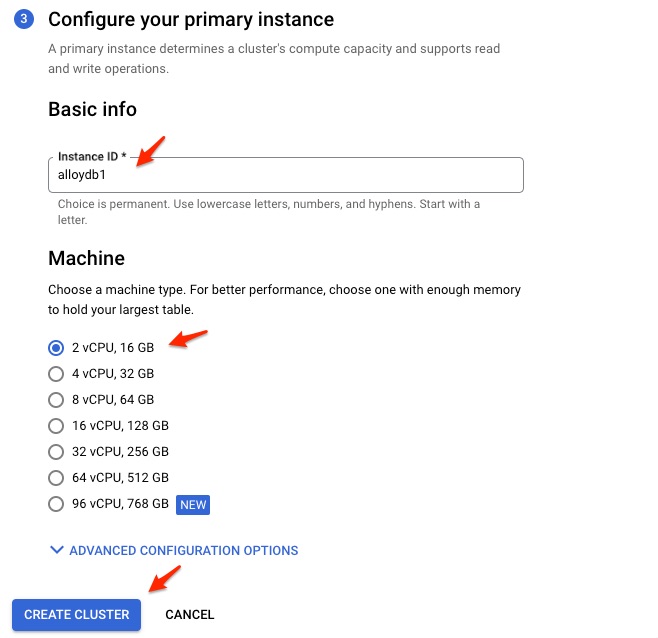
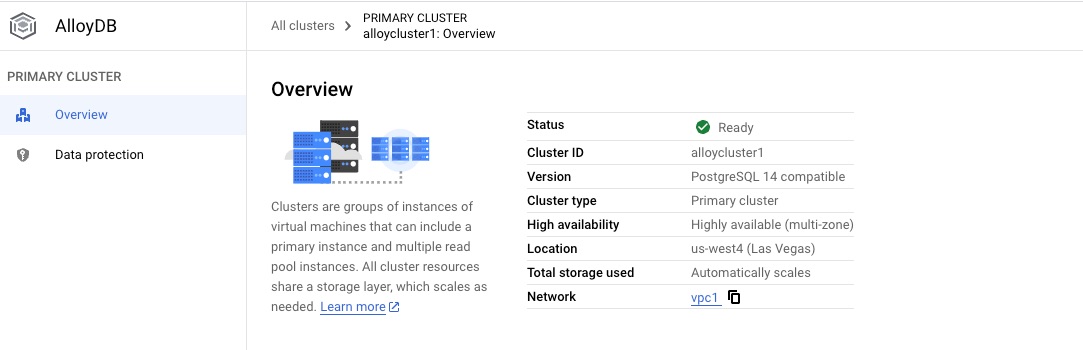
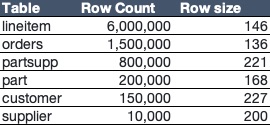
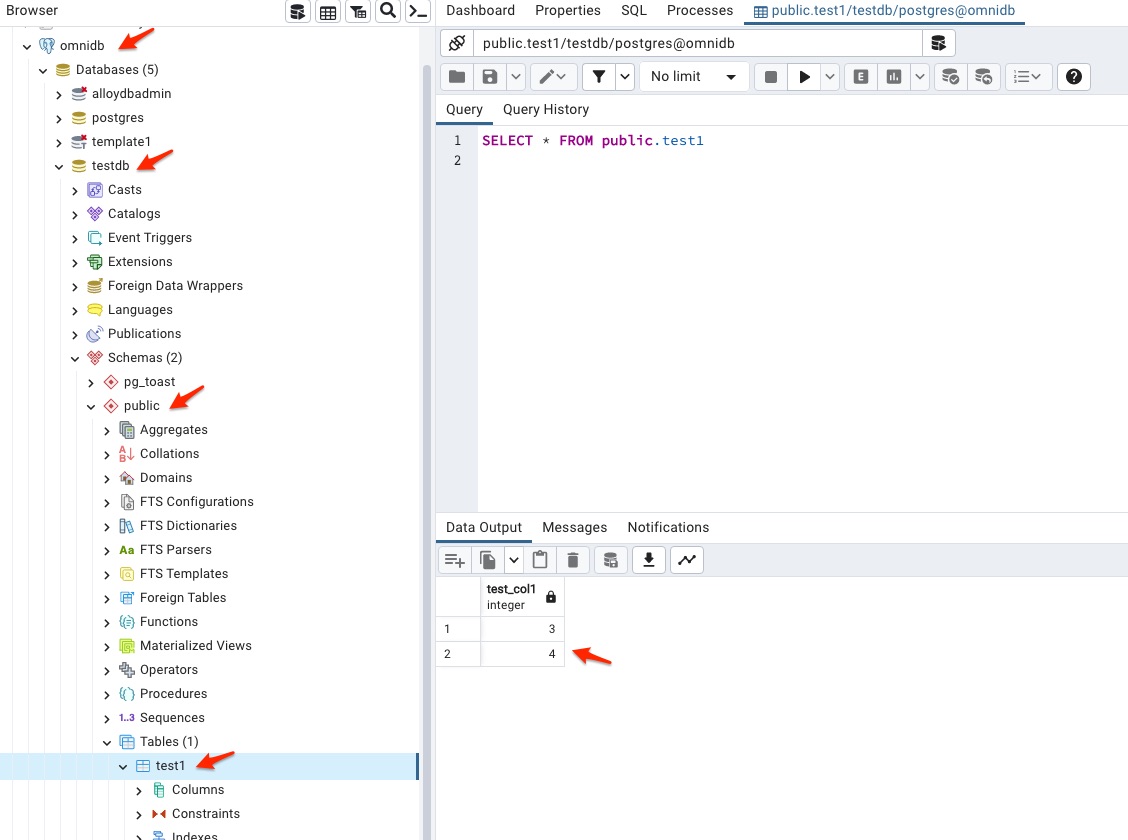
After creating the AlloyDB cluster from Part 6 of the blog series, I reused the pgdb instance from Part 4 as PostgreSQL client to connect to the AlloyDB cluster. Also use the same TPCH 1G data to load into the AlloyDB cluster.
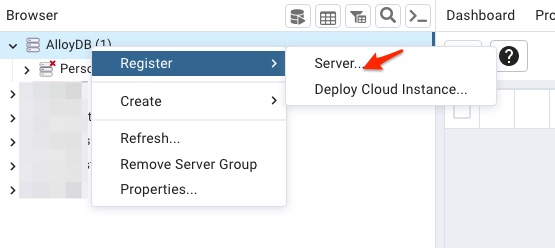
Add Database Flags
AlloyDB has many database flags (why not call them database parameters? Anyway, not a big deal to me. But it makes sense to call some of them, cluster parameters while call others, database parameters.) Under the Instances in the cluster, click EDIT PRIMARY. Then add the following database flags. Some of the flags requires cluster restart. There is one parameter work_mem not in this list, but I discuss more at the end of this blog.
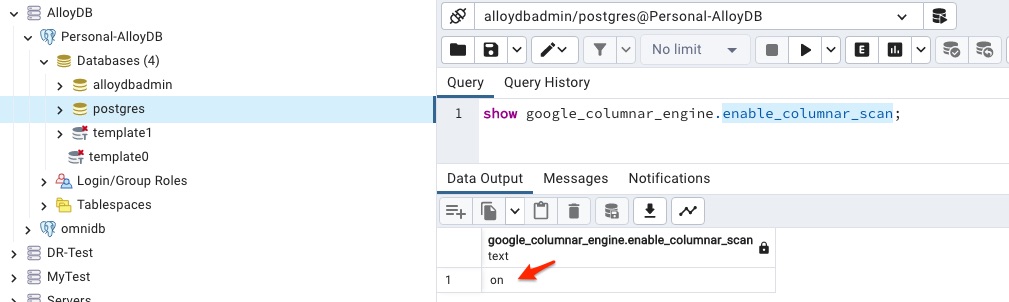
google_columnar_engine.enabled=on
google_columnar_engine.enable_auto_columnarization=on
google_columnar_engine.auto_columnarization_schedule=EVERY 1 DAYS
google_db_advisor.enabled=on
alloydb.enable_pgaudit=on
pgaudit.log=all
pgaudit.log_level=info
alloydb.enable_pg_hint_plan=on
alloydb.enable_auto_explain=on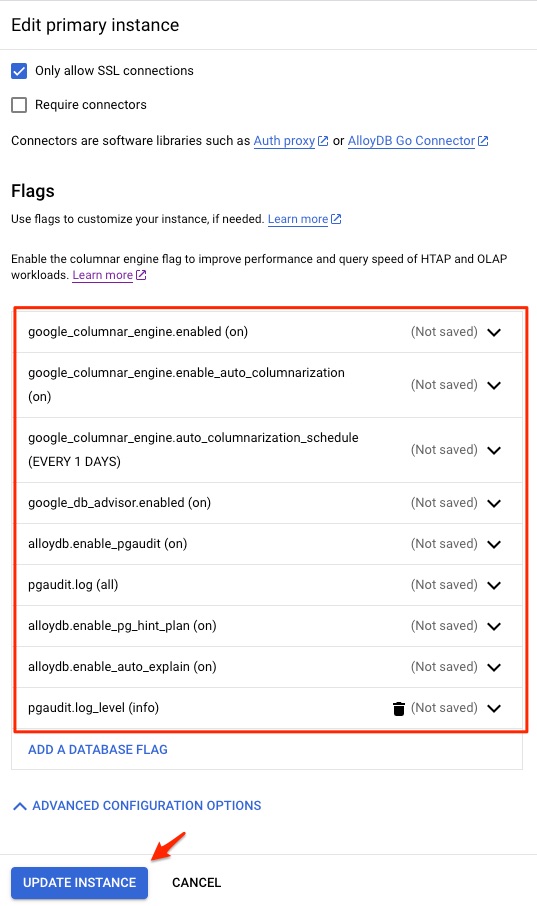
A few notes here about the flags used above:
google_columnar_engine.memory_size_in_mb flag
I did not set columnar engine memory size (google_columnar_engine.memory_size_in_mb) as it would be automatically managed in the future release. By default, it is set to 30% of instance RAM. To understand the memory usage for the columnar engine, run the following. The memory of main_pool is the one when we talk about columnar engine memory usage. The g_columnar_columns view provides the information about what tables and columns are stored in the columnar engine.
tpch_db=> select * from g_columnar_memory_usage;
     memory_name     | memory_total | memory_available | memory_available_percentage | reserved_memory
---------------------+--------------+------------------+-----------------------------+-----------------
 main_pool           |   5035261768 |       4808379160 |                          95 |      1007052353
 recommendation_pool |     14568176 |         14546776 |                          99 |         3059316
 work_pool           |     82837320 |         82686792 |                          99 |        29821435
 column_set          |      1048576 |          1047820 |                          99 |               0
(4 rows)

Time: 1.659 ms
tpch_db=> select database_name db, schema_name schema, relation_name table, column_name column, status, avg_dictionary_count row_count, dictionary_size_in_bytes total_size, to_char(last_accessed_time, 'YYYY-MM-DD') last_access, num_times_accessed freq from g_columnar_columns;
   db    | schema |  table   |     column      | status | row_count | total_size | last_access | freq
---------+--------+----------+-----------------+--------+-----------+------------+-------------+------
 tpch_db | tpch1g | supplier | s_suppkey       | Usable |     10000 |      40000 | 2023-08-26  |   13
 tpch_db | tpch1g | supplier | s_nationkey     | Usable |        25 |        100 | 2023-08-26  |   13
 tpch_db | tpch1g | orders   | o_orderkey      | Usable |    214285 |    6000000 | 2023-08-26  |    9
 tpch_db | tpch1g | orders   | o_custkey       | Usable |     83012 |    2324360 | 2023-08-26  |    9
 tpch_db | tpch1g | orders   | o_totalprice    | Usable |    213528 |   13452273 | 2023-08-26  |    9
 tpch_db | tpch1g | orders   | o_orderdate     | Usable |      2406 |      67368 | 2023-08-26  |    9
 tpch_db | tpch1g | lineitem | l_orderkey      | Usable |     53592 |    6002396 |             |    0
 tpch_db | tpch1g | lineitem | l_partkey       | Usable |    131017 |   14673932 |             |    0
 tpch_db | tpch1g | lineitem | l_quantity      | Usable |        50 |       7000 |             |    0
 tpch_db | tpch1g | lineitem | l_extendedprice | Usable |    189204 |   47679597 |             |    0
 tpch_db | tpch1g | lineitem | l_discount      | Usable |        11 |       1540 |             |    0
 tpch_db | tpch1g | lineitem | l_shipdate      | Usable |      2523 |     282676 |             |    0
 tpch_db | tpch1g | lineitem | l_commitdate    | Usable |      2465 |     276116 |             |    0
 tpch_db | tpch1g | lineitem | l_receiptdate   | Usable |      2540 |     284528 |             |    0
 tpch_db | tpch1g | lineitem | l_shipmode      | Usable |         7 |       1764 |             |    0
(15 rows)

Time: 1.694 ms
 tpch_db=> select database_name db, schema_name schema, relation_name table, swap_status, columns_count col_count, size, cached_size_bytes cached_size from g_columnar_units;
   db    | schema |  table   |  swap_status   | col_count |  size   | cached_size
---------+--------+----------+----------------+-----------+---------+-------------
 tpch_db | tpch1g | supplier | In-memory Only |         2 |   73556 |       73556
 tpch_db | tpch1g | orders   | In-memory Only |         4 | 6727855 |     6727855
 tpch_db | tpch1g | orders   | In-memory Only |         4 | 6732107 |     6732107
 tpch_db | tpch1g | orders   | In-memory Only |         4 | 6730090 |     6730090
 tpch_db | tpch1g | orders   | In-memory Only |         4 | 6731324 |     6731324
 tpch_db | tpch1g | orders   | In-memory Only |         4 | 2427179 |     2427179
 tpch_db | tpch1g | orders   | In-memory Only |         4 | 6729989 |     6729989
 tpch_db | tpch1g | orders   | In-memory Only |         4 | 6728467 |     6728467
 tpch_db | tpch1g | lineitem | In-memory Only |         9 | 6689252 |     6689252
 tpch_db | tpch1g | lineitem | In-memory Only |         9 | 6690421 |     6690421
 tpch_db | tpch1g | lineitem | In-memory Only |         9 | 6692161 |     6692161
 tpch_db | tpch1g | lineitem | In-memory Only |         9 | 6692160 |     6692160
 tpch_db | tpch1g | lineitem | In-memory Only |         9 | 6689679 |     6689679
 tpch_db | tpch1g | lineitem | In-memory Only |         9 | 6686296 |     6686296
 tpch_db | tpch1g | lineitem | In-memory Only |         9 | 6689006 |     6689006
 tpch_db | tpch1g | lineitem | In-memory Only |         9 | 6690120 |     6690120
 tpch_db | tpch1g | lineitem | In-memory Only |         9 | 6692390 |     6692390
 tpch_db | tpch1g | lineitem | In-memory Only |         9 | 6689351 |     6689351
 tpch_db | tpch1g | lineitem | In-memory Only |         9 | 6691490 |     6691490
 tpch_db | tpch1g | lineitem | In-memory Only |         9 | 6687693 |     6687693
 tpch_db | tpch1g | lineitem | In-memory Only |         9 | 6693173 |     6693173
 tpch_db | tpch1g | lineitem | In-memory Only |         9 | 6689057 |     6689057
 tpch_db | tpch1g | lineitem | In-memory Only |         9 | 6691971 |     6691971
 tpch_db | tpch1g | lineitem | In-memory Only |         9 | 6689132 |     6689132
 tpch_db | tpch1g | lineitem | In-memory Only |         9 | 6691352 |     6691352
 tpch_db | tpch1g | lineitem | In-memory Only |         9 | 6687150 |     6687150
 tpch_db | tpch1g | lineitem | In-memory Only |         9 | 3265817 |     3265817
 tpch_db | tpch1g | lineitem | In-memory Only |         9 | 6687438 |     6687438
 tpch_db | tpch1g | lineitem | In-memory Only |         9 | 6690777 |     6690777
 tpch_db | tpch1g | lineitem | In-memory Only |         9 | 6688847 |     6688847
 tpch_db | tpch1g | lineitem | In-memory Only |         9 | 6690904 |     6690904
 tpch_db | tpch1g | lineitem | In-memory Only |         9 | 6692248 |     6692248
 tpch_db | tpch1g | lineitem | In-memory Only |         9 | 6686911 |     6686911
 tpch_db | tpch1g | lineitem | In-memory Only |         9 | 6690797 |     6690797
 tpch_db | tpch1g | lineitem | In-memory Only |         9 | 6689084 |     6689084
 tpch_db | tpch1g | lineitem | In-memory Only |         9 | 6692489 |     6692489
(36 rows)

Time: 1.511 ms
google_db_advisor.enabled flag
It controls whether AlloyDB’s index advisor is enabled or not. This advisor tracks the queries in the database and periodically analyze the queries to see whether to recommend new indexes that may increase the query performance. There are two AlloyDB internal views provide more detail information. They are google_db_advisor_recommended_indexes and google_db_advisor_workload_report.
enable_auto_columnarization flag
It allows columnar engine automatically put data in the column store and improve the performance no matter whether it is hybrid transactional and analytical processing (HTAP) or analytical workload. Right now I set it to 1 day for the default schedule. Run the following commands in psql to check out the schedules for columnar engine.
tpch_db=> SELECT * FROM g_columnar_schedules;
         schedule_name          |    schedule    |           next_time
--------------------------------+----------------+--------------------------
 RECOMMEND_AND_POPULATE_COLUMNS | EVERY 1 DAYS   | 2023-08-27 19:31:40.967188+00
 DATABASE_ADVISOR               | EVERY 24 HOURS | 2023-08-27 19:31:40.967262+00
(2 rows)
If want to run the auto-columnarization immediately, run the following
SELECT google_columnar_engine_recommend();
SELECT database_name, schema_name, relation_name, column_name FROM g_columnar_recommended_columns;
To find out what are stored in the columnar engine, run the following query
tpch_db=> select database_name db, schema_name schema, relation_name table, status, size, columnar_unit_count col_count from g_columnar_relations;
   db    | schema |  table   | status |   size    | col_count
---------+--------+----------+--------+-----------+-----------
 tpch_db | tpch1g | supplier | Usable |     74053 |         1
 tpch_db | tpch1g | orders   | Usable |  42807658 |         7
 tpch_db | tpch1g | lineitem | Usable | 183898365 |        28
(3 rows)

Time: 1.355 ms
If you know what you want to add to the columnar engine, you can use either of the two approaches below to add the table or column data into the columnar engine.
-- add table nation to columnar engine
SELECT google_columnar_engine_add('nation');
-- add o_order_key column of order table to columnar engine
SELECT google_columnar_engine_add('order', 'o_order_key');
For a complete list of database flag, please check out Google database here.
Enable Extensions
After the above database flags are setting on, enable the following extensions in the database:
CREATE EXTENSION IF NOT EXISTS google_columnar_engine;
CREATE EXTENSION IF NOT EXISTS pg_hint_plan;
CREATE EXTENSION IF NOT EXISTS pgaudit;
CREATE EXTENSION IF NOT EXISTS pg_stat_statements;
CREATE EXTENSION IF NOT EXISTS postgres_fdw;
CREATE EXTENSION IF NOT EXISTS sslinfo
Use Query Insights
Query Insights in AlloyDB is a very nice tool to show query performance and detail execution plan. For people like me who use to Oracle OEM, this service is definitely a great plus to provide an idea where is the performance issue in the cluster. Here are some of the screenshot from the Query Insights.
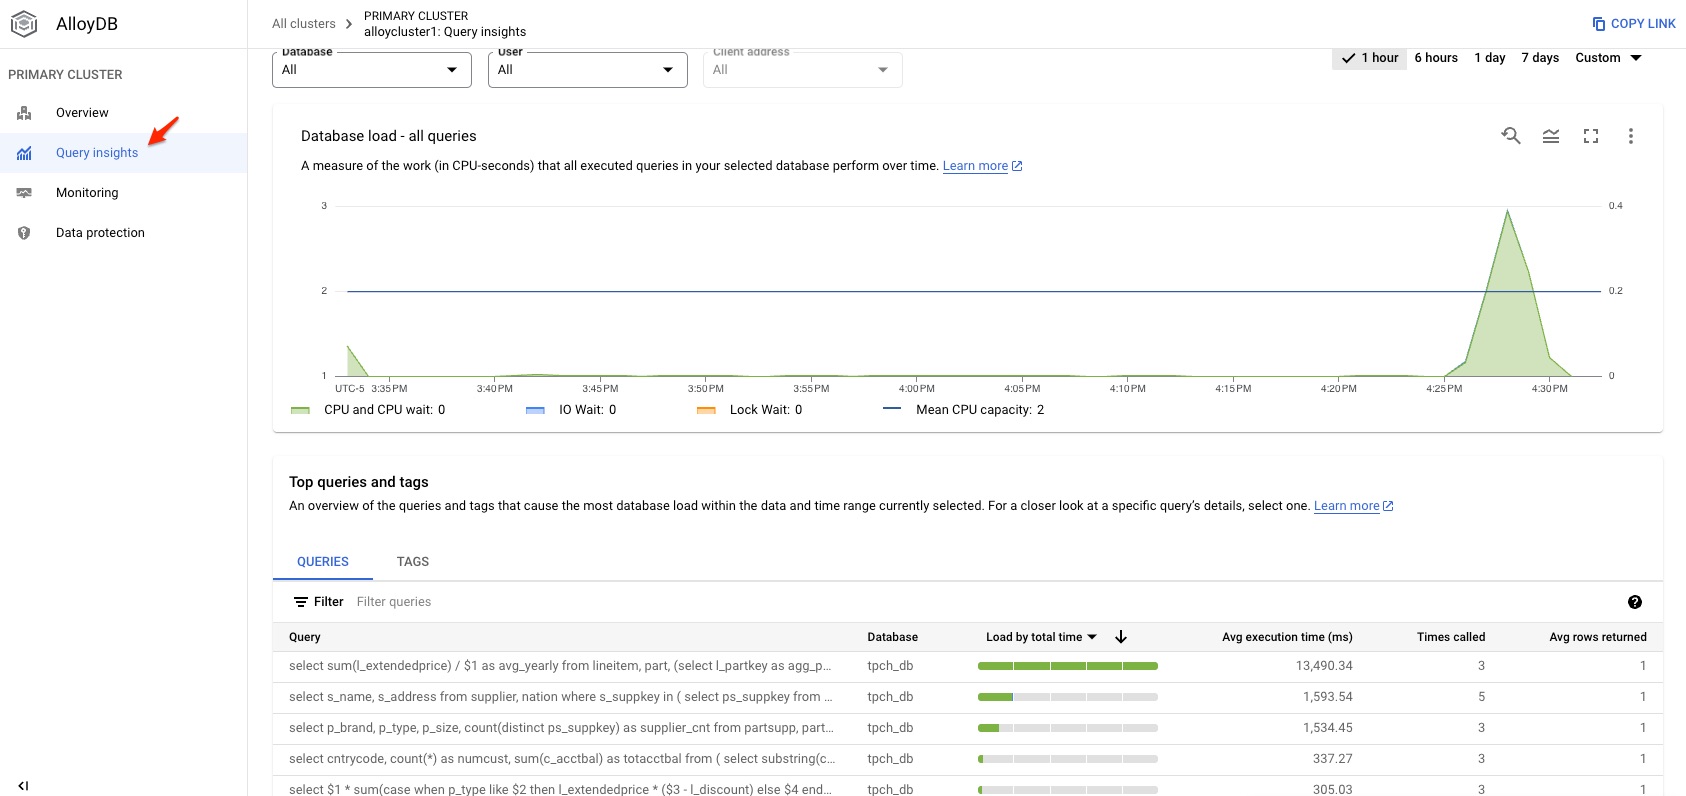
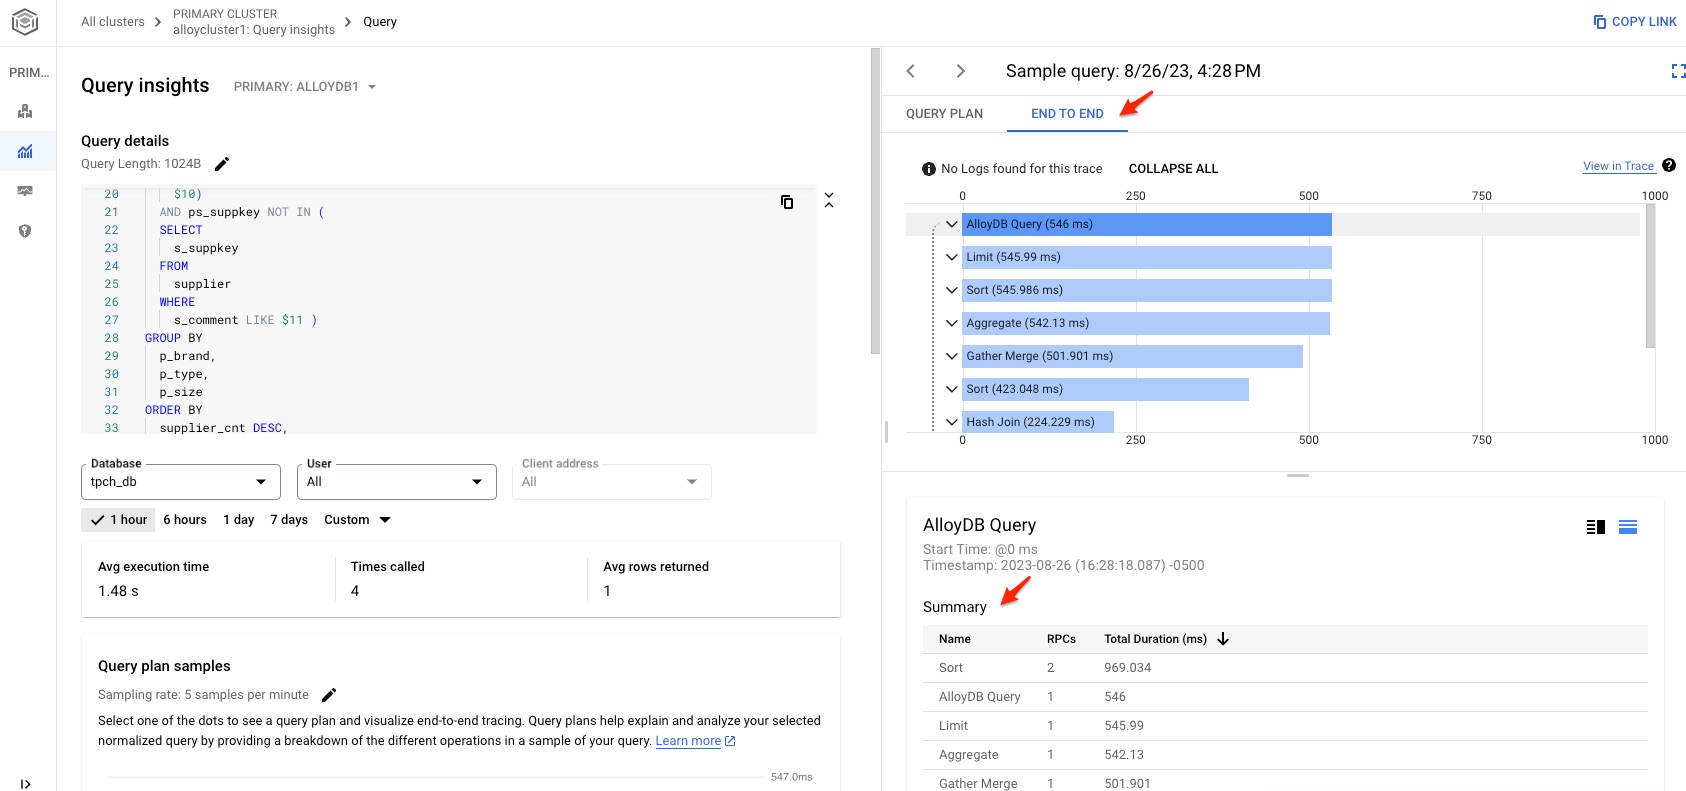
If the query is slow, click the query and check out the execution plan.

It has two kinds of view: Query Plan and End to End. Query plan can give you the detail information about each step during the execution while End to End provides the total timing for each major category.
Review Performance Using Logs Explorer
Not only Query Insights, but also GCP Logs Explorer can provide additional information about the query performance. To use Logs Explorer, choose Resource Type as AlloyDB instance, then pick the time window to review the detail logs from AlloyDB. Here is one sample screenshot.
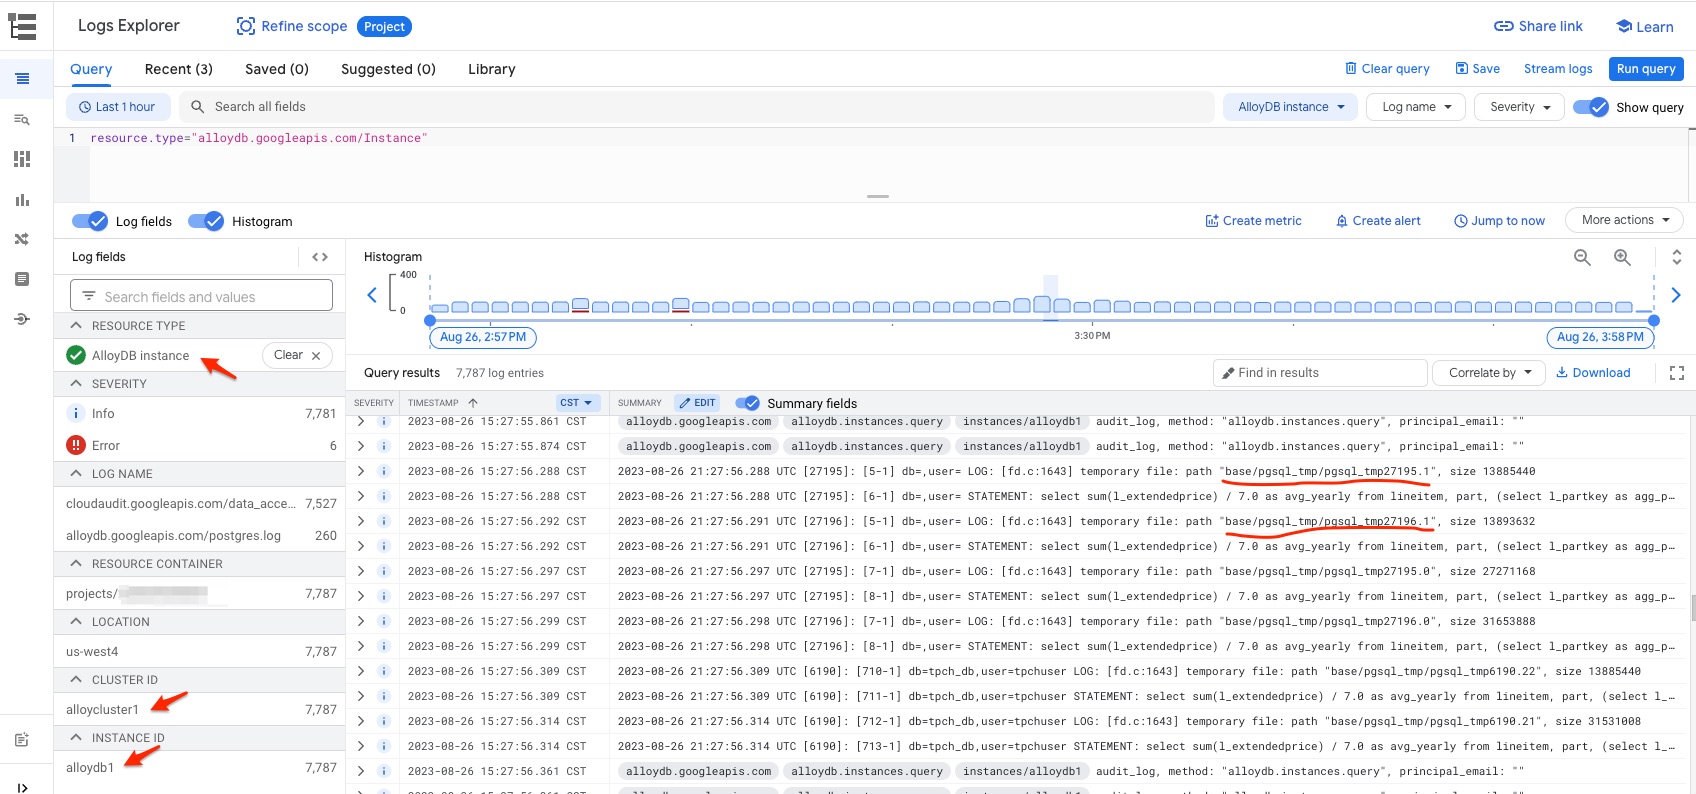
The interesting observation from the above log show some temporary files are created with size from around 13 MB to 30 MB. Temporary files are usually created when the query requires sort operation and work_mem parameter is not big enough.
When sort requires more memory than this parameter, it has to write to temporary files on disk. The sort operation include SQL statements like ORDER BY, DISTINCT, merge join and building hash table during the hash join. If the sort operation can be performed within the work_mem, it uses quicksort algorithm. If no enough memory in work_mem, external merge disk algorithm is used to split between disk and memory, and then merge the result in the end. This is usually a costly operation as physical IO is required. So setting this parameter to a correct value is very important to improve the query performance.
Although the work_mem parameter can be set to a value between 64KB and 2TB, it is 4MB by default. Because this is usually not enough for analytical type of workload, 65536 (64MB) is usually the recommended value for work_mem parameter. Can I set this parameter to a much bigger value? Yes, of course, but it may come with cost. It depends on max_connections parameter. Each database connection will have its own work_mem area. With too many database connections and large size of work_mem, you may see out of memory issue during busy load period. So determine the right value for the workload is important. Shane Borden has a nice blog talking about work_mem parameter and you can find the check out his article at Tuning the PostgreSQL “work_mem” Parameter.
There are another reason why we can see these kind of temporary files. By default, the log_temp_files parameter is set to 0. The value of 0 for log_temp_files means all temporary files, big or small, are going to show up in the log entry. If setting this parameter to 20480, then only temporary files with size >= 20 MB will show up in the logs.
Final Thoughts
At this moment, I complete this blog series of the introduction of AlloyDB and AlloyDB Omni. Hopefully this blog series can help people to learn and use AlloyDB products. I also list some of good articles about AlloyDB below. Enjoy reading!
Verify Columnar Engine Usage with AlloyDB Operational Views by Anish Nair
Leverage Google Cloud Logging + Monitoring for Custom Cloud SQL for Postgres or AlloyDB Alerts by Shane Borden
Essential SQL for exploring AlloyDB Columnar Engine by Deepak Mahto
Enhancing Google Cloud AlloyDB Interaction with Custom psql Shortcuts by Deepak Mahto
An Initial Test of Google’s AlloyDB Columnar Engine by Simon Pane


You must be logged in to post a comment.