Direct Path Read vs Buffer Cache Read

I want to write this topic a few years back, but never have had the chance to write a blog about it. When I had time to write the topic, I don’t have the access to the real case. When I have the access to the real case, I was busy in taking care of other stuffs. Finally, I have time and real case to discuss this topic and this is the main purpose for this post.

There are tons of articles and blogs discussing Direct Path Read and Buffer Cache Read and I am not going to repeat their findings. The good ones are Tanel‘s Optimizer statistics-driven direct path read decision for full table scans, Alex Fatkulin‘s 11G adaptive direct path reads — what is the cached/dirty blocks threshold?, Doug Burn‘s 11g and direct path reads and Frits Hoogland‘s Investigating the full table direct path / buffered decision. These are very good articles and have many test cases you can play with in your environment. This post discusses the processes and steps I use to analyze the performance issue related to Direct Path Read from a production environment.

At the time when we look at a query’s execution plan, if seeing TABLE ACCESS FULL, there are only two ways to go to perform full table scan:
1. Conventional path read or buffer cache read
2. Direct path read
different_direction
For direct path read, SGA is bypassed and the blocks are read directly into PGA. Direct path read is faster than scattered reads because it can avoid latches. But on the other hand, oracle needs to count the total number of dirty blocks in the memory for each table/segment or go though the checkpoint queue to count the buffers. The checkpoint is done for the segment to make all the blocks of the segment up-to-date. You could see enq: KO – fast object checkpoint event just before the direct path read.

The performance issue related Direct Path Read is from a small 12c production database with only 4GB SGA and buffer cache is about 2.5 GB. This query is pretty simple, just doing full table scan.

SQL_ID  fqf3hk93j5k4n, child number 0
-------------------------------------
SELECT CLIENT_ID,STATUS,SHP_ID FROM INV_APP_NRD.SAL_SHIPWS
WHERE CLIENT_ID = :1

Plan hash value: 2885481213
--------------------------------------------------------------------------------
| Id  | Operation         | Name       | Rows  | Bytes | Cost (%CPU)| Time     |
--------------------------------------------------------------------------------
|   0 | SELECT STATEMENT  |            |       |       |  3035 (100)|          |
|*  1 |  TABLE ACCESS FULL| SAL_SHIPWS |     1 |    30 |  3035   (1)| 00:00:01 |
--------------------------------------------------------------------------------

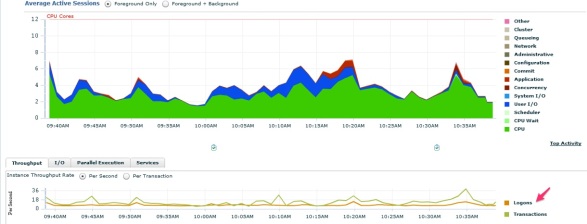
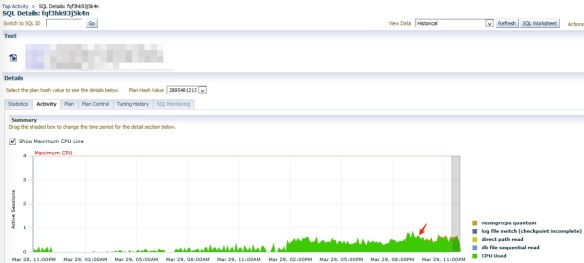
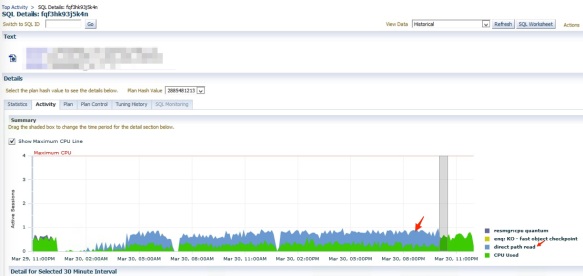
Although the query can complete within half second, the total number of executions make it always top 5 queries in the database. I made a recommendation to add an index before this incident happened, but the recommendation has never been approved and implemented in the production. Before the issue happened, the query is mainly on CPU, see the screenshot below. When the issue happened, it shows significant Direct Path Read event. To find out why there was sudden change in the query performance, I did some analysis to investigate why it happened.

Before the issue happened
query_buffer_cache_read_201604

After the issue happened
query_direct_path_read_201604

As always, I run awr_plan_change.sql first and get the following result:
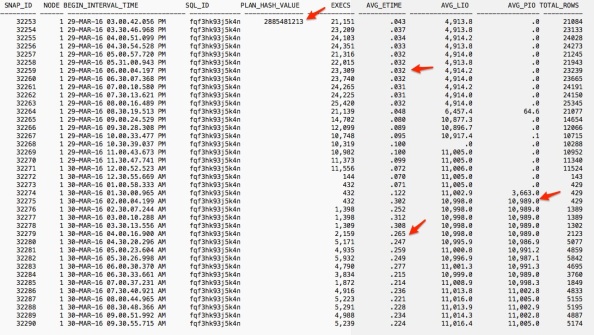
awr_plan_change_result_201604

The result shows the following:
1. The query is still using the same plan with the same hash value. So I can rule out the possibility that performance was caused by a plan change.

2. The average LIO is roughly no change with about 4,900 before 8:30pm on Mar. 29. Then suddenly shot up 6,457 half hour latter. Then to 11,000 for the rest of day and Mar. 30. The performance issue happened around 2am Mar. 30 when almost same physical IO (PIO) as LIO happened. I can see the average run time shot up from 0.032 to about 0.23, about 8~10 times slower than before.

I know this sudden change to direct path read is very likely caused by _small_table_threshold. _small_table_threshold is a hidden parameter that defines the number of blocks to consider a table as being small. You can use the following query to find out this value.

select ksppstvl
from x$ksppi x, x$ksppcv y
where (x.indx = y.indx)
and ksppinm='_small_table_threshold';

Unfortunately I don’t have the access to the X$ tables. So I use another way: 2% of buffer cache. I have verified this number in the past and my tests shows value of _small_table_threshold is somewhere between 1.84%~2% of buffer cache. For small table, full table scan always read into buffer cache. If size of the table or segment > 5*_small_table_threshold or 10% of buffer cache, then the table/segment is considered Large table and always uses Direct Path Read. For table between small and large table, it is Medium size table, i.e, between 2% and 10% of buffer cache. For Medium size table, sometimes it uses Direct Path Read and sometime it uses Buffer Cache Read. One popular opinion is when 50+% of table blocks are in buffer cache or dirty, the full scan uses buffer cache read while direct path read covers the rest of scenario. Frits’ article discussed his tests on 12c database and said for medium size table, 50% dirty rule still hold true for buffer cache read, but at least 99% of blocks in buffer cache can make full table scan use Buffer Cache Read instead of Direct Path Read. For majority of cases, it’s unlikely to have 50% blocks in a segment changed in a short time. It’s also unlikely to have almost all blocks (99+%) in the buffer cache for a busy database. So if Frits’ opinion is correct, we will likely to see Direct Path Read for a full table scan once the table/segment size exceeds _small_table_threshold.

The value of _small_table_threshold is in block counts. The block count is taken from statistics in the data dictionary. But optimizer does not make the decision for direct path read, it is a run time decision done during every execution. Parallel queries are always using direct path read. For non-parallel queries, the change of current buffer cache size or the number of blocks in the cache will have the impact in the decision to go with direct path read or buffer cache read. If you feel RDBMS does not make correct decision to use direct path read, you may try _serial_direct_read parameter at session level, which I would not recommend doing so.

To understand more, let’s look at the few moving parts related to this issue:
Dirty Blocks
Ideally I would use X$BH to find out the number of dirty blocks. Unfortunately I don’t have the access to X$BH. Instead I check out dba_tab_modifications to get rough estimation whether there are many changes in the table.

col table_name for a30
col table_owner for a20

select *
  from ( select m.table_owner
              , m.table_name
              , t.last_analyzed
              , m.inserts
              , m.updates
              , m.deletes
              , t.num_rows
              , ( m.inserts + m.updates + m.deletes )*100 / case when t.num_rows is null or t.num_rows = 0 then 1 else t.num_rows end "Change Factor%"
           from dba_tab_modifications m
              , dba_tables t
           where t.owner = m.table_owner
             and t.table_name = m.table_name
             and m.inserts + m.updates + m.deletes > 1
             and m.table_owner='INV_APP'
             and m.table_name like 'SAL_SHIPWS'
           order by "Change Factor%" desc
       )
;

TABLE_OWNER TABLE_NAME LAST_ANALYZED INSERTS UPDATES DELETES NUM_ROWS Change Factor
----------- ---------- ------------- ------- ------- ------- -------- -------------
INV_APP     SAL_SHIPWS 29-MAR-16     10687   11359   0       1897664  1.1617441

There is only 1.16% of rows get modified since last analyzed time one night before, far below the 50% dirty threshold. So I can rule out the possibility from dirty blocks.

The Buffer Cache Size
I run the following query to show the size of buffer cache and 2%of buffer cache in MB and blocks.

col component for a25
col size_MB for 999,999
col stth head "Small Table|Threshold in Blks" for 99,999,999
col stth_size head "Small Table|Threshold|in MB" for 999,999
select component, current_size/(1024*1024) size_MB, 
current_size/8192 * 0.02 stth,
current_size/(1024*1024) * 0.02 stth_size
from v$sga_dynamic_components
where 
component like 'DEFAULT buffer cache%';
                                                 Small Table
                                     Small Table   Threshold
COMPONENT              SIZE_MB Threshold in Blks       in MB
--------------------- -------- ----------------- -----------
DEFAULT buffer cache     2,496             6,390          50

We can see the 6,390 blocks is the magic number that will decide whether the table is a small table or not.

Table size
Remember the decision related to use direct path read is not based on the current size of table, but the value at the time when last stats was captured. So I run the following the query to get the latest stat info related to the table.

col owner for a20
col table_name for a25
col last_analyzed for a20
select owner, table_name, 
object_type, to_char(last_analyzed, 'yyyy-mm-dd hh24:mi:ss') last_analyzed, 
blocks, num_rows, sample_size sample
from  dba_tab_statistics
where
owner ='INV_APP'
and table_name ='SAL_SHIPWS';
 
OWNER   TABLE_NAME OBJECT_TYPE LAST_ANALYZED       BLOCKS  NUM_ROWS SAMPLE   
------- ---------- ----------- ------------------- ------- -------- -------
INV_APP SAL_SHIPWS TABLE       2016-03-29 22:00:34 11131    1897664 1897664 

Ok, 11131 blocks is greater than the small table threshold of 6390 blocks. So the table size is definitely the factor triggering the direct path read. Then my next question is that why this thing happens right now, but never in the past. It might be considered as small table in the past. Run the following query to check out the stats history for the table.

col owner for a12
col object_name for a25
col object_type for a15
col subobject_name for a25
col obj# for 999999
col save_time for a20
col analyze_time for a20
select o.owner, o.object_name, o.subobject_name, th.obj#, o.object_type,
to_char(analyzetime, 'yyyy-mm-dd hh24:mi:ss') analyze_time,
rowcnt, blkcnt, avgrln, samplesize, samplesize, 
to_char(savtime, 'yyyy-mm-dd hh24:mi:ss') save_time
from sys.WRI$_OPTSTAT_TAB_HISTORY th,
dba_objects o
where
o.object_id = th.obj#
and o.owner = 'INV_APP'
and o.object_name = 'SAL_SHIPWS'
order by th.analyzetime desc;

OWNER   OBJECT_NAME OBJ#   OBJECT_TYPE ANALYZE_TIME        ROWCNT  BLKCNT AVGRLN SAMPLESIZE SAMPLESIZE SAVE_TIME
------- ----------- ------ ----------- ------------------- ------- ------ ------ ---------- ---------- ------------------- 
INV_APP SAL_SHIPWS  146907 TABLE       2016-03-25 22:02:20 831675  4668       47     831675     831675 2016-03-29 22:00:35
INV_APP SAL_SHIPWS  146907 TABLE       2016-03-16 22:02:08 798969  4542       47     798969     798969 2016-03-25 22:02:20
INV_APP SAL_SHIPWS  146907 TABLE       2016-03-08 22:00:42 770679  4416       47     770679     770679 2016-03-16 22:02:08
INV_APP SAL_SHIPWS  146907 TABLE       2016-02-29 22:02:05 343578  2022       47     343578     343578 2016-03-08 22:00:42
INV_APP SAL_SHIPWS  146907 TABLE       2016-02-18 22:01:34 346437  2022       47     346437     346437 2016-02-29 22:02:05
INV_APP SAL_SHIPWS  146907 TABLE       2016-02-05 22:01:21 335163  1896       47     335163     335163 2016-02-18 22:01:34
INV_APP SAL_SHIPWS  146907 TABLE       2016-01-20 22:09:22 323044  1896       47     323044     323044 2016-02-05 22:01:21

The result clearly shows all of the block counts are less than 6390 and the table was always considered as small table in the past.

Wait Event
The above queries and results show the direct path read is very likely outcome. Then I need to prove the wait event is indeed related to direct path read. Run the following query:

col session for a20
col wait_class for a20
col event for a40
col total for 999,999
col read_io_mb for 999,999.9
select sql_id, sql_plan_hash_value hash_val, to_char(sample_time, 'yyyy-mm-dd hh24') sample_time, session_state, wait_class, event, count(*) total, sum(delta_read_io_bytes)/(1024*1024) read_io_mb
from DBA_HIST_ACTIVE_SESS_HISTORY 
where
sql_id='fqf3hk93j5k4n'
and sample_time > sysdate - 2
group by sql_id, sql_plan_hash_value,to_char(sample_time, 'yyyy-mm-dd hh24'), session_state, wait_class, event
order by sample_time;

SQL_ID        SAMPLE_TIME   SESSION WAIT_CLASS    EVENT                                       TOTAL READ_IO_MB
------------- ------------- ------- ------------- ---------------------------------------- -------- ----------
fqf3hk93j5k4n 2016-03-29 14 ON CPU                                                               37      134.7
fqf3hk93j5k4n 2016-03-29 15 ON CPU                                                              172      154.0
fqf3hk93j5k4n 2016-03-29 16 ON CPU                                                              162         .5
fqf3hk93j5k4n 2016-03-29 17 ON CPU                                                              138        5.2
fqf3hk93j5k4n 2016-03-29 18 ON CPU                                                              152      134.8
fqf3hk93j5k4n 2016-03-29 19 ON CPU                                                              138    1,629.9
fqf3hk93j5k4n 2016-03-29 20 ON CPU                                                              183    9,953.9
fqf3hk93j5k4n 2016-03-29 20 WAITING Configuration log file switch (checkpoint incomplete)         1        7.1
fqf3hk93j5k4n 2016-03-29 20 WAITING User I/O      direct path read                                2    1,519.9
fqf3hk93j5k4n 2016-03-29 21 ON CPU                                                              229      335.8
fqf3hk93j5k4n 2016-03-29 22 ON CPU                                                              179      552.1
fqf3hk93j5k4n 2016-03-29 22 WAITING Scheduler     resmgr:cpu quantum                             17        2.6
fqf3hk93j5k4n 2016-03-29 22 WAITING User I/O      db file sequential read                         1         .7
fqf3hk93j5k4n 2016-03-29 23 ON CPU                                                              190      670.0
fqf3hk93j5k4n 2016-03-29 23 WAITING Scheduler     resmgr:cpu quantum                             26
fqf3hk93j5k4n 2016-03-30 00 ON CPU                                                               76      188.8
fqf3hk93j5k4n 2016-03-30 00 WAITING Scheduler     resmgr:cpu quantum                              2
fqf3hk93j5k4n 2016-03-30 01 ON CPU                                                                4      269.4
fqf3hk93j5k4n 2016-03-30 01 WAITING User I/O      direct path read                                2    3,992.1
fqf3hk93j5k4n 2016-03-30 02 ON CPU                                                               15   43,887.2
fqf3hk93j5k4n 2016-03-30 02 WAITING User I/O      direct path read                               33  107,623.2
fqf3hk93j5k4n 2016-03-30 03 ON CPU                                                               25  101,191.1
fqf3hk93j5k4n 2016-03-30 03 WAITING User I/O      direct path read                               50  127,974.5
fqf3hk93j5k4n 2016-03-30 04 ON CPU                                                               74  252,514.8
fqf3hk93j5k4n 2016-03-30 04 WAITING User I/O      direct path read                              117  326,216.4
fqf3hk93j5k4n 2016-03-30 05 ON CPU                                                              100  351,210.6
fqf3hk93j5k4n 2016-03-30 05 WAITING Application   enq: KO - fast object checkpoint                1    1,315.1
fqf3hk93j5k4n 2016-03-30 05 WAITING User I/O      direct path read                              173  502,828.0
fqf3hk93j5k4n 2016-03-30 06 ON CPU                                                               63  195,762.7
fqf3hk93j5k4n 2016-03-30 06 WAITING Application   enq: KO - fast object checkpoint                1      985.5
fqf3hk93j5k4n 2016-03-30 06 WAITING User I/O      direct path read                              159  491,567.9
fqf3hk93j5k4n 2016-03-30 07 ON CPU                                                               79  243,513.4
fqf3hk93j5k4n 2016-03-30 07 WAITING User I/O      direct path read                               75  271,548.4
fqf3hk93j5k4n 2016-03-30 08 ON CPU                                                               91  316,045.2
fqf3hk93j5k4n 2016-03-30 08 WAITING User I/O      direct path read                              137  498,446.2
fqf3hk93j5k4n 2016-03-30 09 ON CPU                                                               79  329,797.0
fqf3hk93j5k4n 2016-03-30 09 WAITING User I/O      direct path read                              141  497,647.9
. . . .
fqf3hk93j5k4n 2016-03-30 20 ON CPU                                                               81  221,629.5
fqf3hk93j5k4n 2016-03-30 20 WAITING User I/O      direct path read                              215  608,258.5
fqf3hk93j5k4n 2016-03-30 21 ON CPU                                                               81  275,751.3
fqf3hk93j5k4n 2016-03-30 21 WAITING User I/O      direct path read                              202  589,110.1
fqf3hk93j5k4n 2016-03-30 22 ON CPU                                                              193    6,965.6
fqf3hk93j5k4n 2016-03-30 22 WAITING User I/O      direct path read                               30   25,242.7
fqf3hk93j5k4n 2016-03-30 23 ON CPU                                                              245      137.6
fqf3hk93j5k4n 2016-03-31 00 ON CPU                                                               89      538.7
fqf3hk93j5k4n 2016-03-31 01 ON CPU                                                               11    1,213.2
fqf3hk93j5k4n 2016-03-31 02 ON CPU                                                               11   16,901.3
fqf3hk93j5k4n 2016-03-31 02 WAITING User I/O      direct path read                               33   83,902.7
fqf3hk93j5k4n 2016-03-31 03 ON CPU                                                               23   47,317.6
fqf3hk93j5k4n 2016-03-31 03 WAITING User I/O      direct path read                               79  177,203.5
fqf3hk93j5k4n 2016-03-31 04 ON CPU                                                               59  144,902.3
fqf3hk93j5k4n 2016-03-31 04 WAITING User I/O      direct path read                              161  438,593.4
fqf3hk93j5k4n 2016-03-31 05 ON CPU                                                               93  279,670.5

The above result indeed shows the wait event pattern change. From purely ON CPU to direct path read

Am I done with the analysis? Not yet. If you look at the above result carefully, you will notice the pattern change to “ON CPU” again between 22:30 and 2am next day. I verified the table size did not change and the table is still considered Medium size table. It becomes more interesting. Then I observed the same behavior during the same timeframe the next day. At this moment, I know it could relate to Oracle’s AUTO Jobs, which are running during the same timeframe. Yes, I indeed found some SQLs from SQL Analyzer with the query like this /* SQL Analyze(2722,1) */ SELECT CLIENT_ID,STATUS,SHP_ID FROM INV_APP_NRD.SAL_SHIPWS WHERE CLIENT_ID = :1. I guess this SQL analyzer loads all blocks from this table into buffer cache. It forces the run time decision to use buffer read instead of direct path read. After 2am when some blocks are flushed out of buffer cache and total number of blocks of this table is below certain threshold, maybe 99% as Frits pointed out, then the run time decision would favor direct path read.

Solutions
Ok at this moment, I am done with the analysis and it is pretty much matching what I thought originally. The next question everyone would ask what I can do with it. If you don’t want to direct path for your queries, there are a few options:

Tune the SQL
For very large table, if queries do the full scan of the table less frequently, say, once a week, there is no point to place these blocks in the buffer cache and you want to use Direct Path Read. For full scan of tables no matter whether large or small, if happens very frequently, then the large number of executions of the query using Direct Path Read will make the SQLs expensive. One way to check the cardinality of the predicate in the query and add an index if necessary. Actually this is the top recommendation I made for this query. Adding a new index on CLIENT_ID will scan only less than 50 rows instead of 1.9 million rows.

Increase SGA size
In case you can not tune the query, increasing SGA size will be your next option. If increase SGA size, the db cache size will increase. It means the increase of the value of _small_table_threshold. This is another common solution.

Change _small_table_threshold
You could change the value of _small_table_threshold parameter. But I don’t think this is a good idea to touch this parameter.

Cache the table
This is an interesting solution I have never used or tested before. But theoretically it should work: using ALTER TABLE tableName CACHE. Please note, it does not mean storing all blocks from the table in the buffer cache, but just tell Oracle to handle the blocks differently when they get into the cache. In other words, the table would be ALWAYS treated as small table regardless of the actual size of the table.
When you create or alter a table, you have 3 options: CACHE, or NOCACHE, or CACHE READS.
NOCACHE is the default value and this is what everyone uses for the majority of tables. When oracle is doing a full scan of a table/segment, it places the blocks onto the least recently end of Least Recently Used (LRU) list in the buffer cache. So it makes these blocks more prone to being aged out of the buffer cache. So for some data that is accessed frequently, CACHE allows you to place the blocks of the tables at the other side of the list, the most recently used end of LRU list, when a full table scan is performed.

CACHE READS applies only to LOB storage. It’s useful when you want to bring LOB values into the buffer cache only during read, not during write operations. By the way, when creating table with LOB column, you could specify CACHE option in the LOB_storage_clause to places LOB data values in the buffer cache for faster access. By the default, both BasicFiles and SecureFiles LOBs is doing NOCACHE LOGGING. The downside of caching LOBs is when not using carefully, the flooding of cache of LOB object would force rest of database data out of buffer cache and have more Disk Read rather than cache hits for non-LOB data. This is uncommon behavior and SGA increase could improve the performance from this issue.
Capture the Cause of Excessive Logon Activities

I have been to many clients for the past few years and one of common issues is the excessive logon activities. From what I observe, excessive logon activities are mainly from two areas.

1) The first one is the logon storm. This behavior usually happens in a database that is shared by multiple applications. As poorly performed queries from one application can easily have impact on the performance of other applications, other application teams might feel not have enough db resource dedicating to their application and use their own ways to get the resource they needs by firing up hundreds of threads within a tiny time window, logon to db, do some insert and update work, and logoff. This one can be easily spotted from OEM by a huge spike in Active Sessions. I am not going to discuss this one in this blog, but talking about the second category.
2) The second category is almost unnoticeable, continuous logon activities that comes in a way like memory leak. Database performs ok, but over time audit table AUD$ grows at a much faster rate than it should be. At the time when AUD$ table is so big, any insert or query activities on AUD$ table can be easily seen as one of top 10 queries on OEM. Just like the house surrounded by the water. When want to get out, it is too late. This issue is usually caused by the design or configuration issue on application side. This blog discusses how to identify this issue from database side and provide useful information for application side to track down the cause of the issue.

house_surround_by_water

How to identify whether we have excessive logon activities?
First, goto OEM’s Performance Home page and pay attention to the Logon activities at the bottom of the pages. If you see a constant line with logons > 0 all the time, it means something is not right in the logon, especially if the database is small and not many users are using it. The following screenshot shows a logon rate of 10 all the time. We could have logon rate of 10 for certain time with a pattern of up and down, but sustain this number all the time usually means issue in logon activities.
1_OEM_Logon_Rate

Next, I usually run the following script to capture who are the top contributors of this excessive logon activities. It shows the users with logon frequency > 100 for the past 15 minutes.

col os_username for a15
col username for a18
col userhost for a15
col avg_sess_cpu for 99,999
col total for 999,999

prompt show all users login info with logon freqency > 100 for the past 15 minutes
select os_username, username, userhost, action_name action, count(*)
from dba_audit_trail
where timestamp > sysdate - 1/24/4
having count(*) > 100
group by  os_username, username, userhost, action_name
order by os_username, username, userhost;

Here is the sample output from the query:

OS_USER USERNAME      USERHOST    ACTION            COUNT(*)
------- ------------- ----------- ----------------- --------
. . . .
x1w01  APP_SUPWOK     kprodw327   SET ROLE               210
x1w01  APP_SUPWOK     kprodw328   SET ROLE               105
x1w01  APP_RTL01      kprodw333   LOGOFF                 118
x1w01  APP_RTL01      kprodw333   LOGON                  118
x5w01  APP_RTL01_ORD  kprodw447   LOGOFF BY CLEANUP     9520
x5w01  APP_RTL01_ORD  kprodw447   LOGON                 9522
x5w01  APP_RTL01_ORD  kprodw448   LOGOFF BY CLEANUP     2664
x5w01  APP_RTL01_ORD  kprodw448   LOGON                 2661

The above result shows APP_RTL01_ORD user has the largest number of logon/logoff activities and has about 12,000+ logon activities from two hosts, kprodw447 and kprodw448.

What’s the logon activities look like?
This kind of excessive logon session usually has a very short life: logon, executes one or a few queries, and then gone. So I have to run the following query multiple times within a few seconds to create my own snapshot. For this test, I am checking APP_RTL01_ORD user and kprodw447 host.

col right_now for a20
col logon_time for a20
col inst for 9999
col username for a18
col osuser for a8
col sid for 99999999
col machine for a10
col proc for a5
col port for 99999
col program for a20
col event for a15 trunc
select to_char(sysdate, 'yyyy-mm-dd hh24:mi:ss') right_now, to_char(logon_time, 'yyyy-mm-dd hh24:mi:ss') logon_time, 
inst_id inst, sid, serial#, audsid, username, status, osuser, machine, process proc, port, program, 
sql_id, sql_hash_value hash_val, prev_sql_id, prev_hash_value prev_hash, event
from gv$session 
where 
username='APP_RTL01_ORD' and machine='kprodw447' 
order by logon_time;

The following is the execution result. We can see only the first two sessions (SID 1329 and 2330) are in the all of three snapshots while the rest of sessions are gone. If those sessions are gone, it means the old sessions were closed and new sessions are opened. So I picked the 2nd snapshot in the middle and used the sessions with audid column is red to do further analysis.
2_session_snapshot

You might notice there is audsid column in the query. The reason why I includes it in the query is that there is no SID and Serial# columns in SYS.AUD$ table. AUDSID is Auditing Session ID, a unique identifier for the user session. Confusingly, this column is called AUDSID in V$SESSION, but SESSIONID in SYS.AUD$. When a new user session is created, the SYS.AUDSES$ sequence is incremented using NEXTVAL and the new value is assigned to the session as its AUDSID. In case of sessions connecting as ‘internal’, AUDSID is set to 0 and SYS.AUDSES$ sequence is not incremented. The common used query select userenv(‘SESSIONID’) from dual is actually getting this AUDSID.

For more information about AUDSID, please refers to Oracle Doc: How Sessions get Their AUDSID Identifier (Doc ID 122230.1).

How long each logon session last?
Although I feel the session has short life, I don’t know the exact time for the session. So next step, I need to pull the logon and logoff records from dba_audit_trail. I used the audsid information captured from the last step and run the following query.

col logoff_time for a20
col priv_used for a15
col comment_text for a50 wrap
select sessionid audsid, os_username osuser, username, userhost machine, os_process proc, 
to_char(timestamp, 'yyyy-mm-dd hh24:mi:ss') time, to_char(logoff_time, 'yyyy-mm-dd hh24:mi:ss') logoff_time, 
action_name, priv_used, session_cpu, comment_text 
from
dba_audit_trail 
where
sessionid in (120893447,120893450,120893448,120893445,120893451,120893453,120893452) 
order by sessionid, timestamp;

The result proves my assumption is right. All of these session shows the same pattern: logon and logoff within a second.
3_session_logon_logoff_history

What kind of queries used in these short life sessions?
In the 2nd step, I marked those queries in red and let me check out the content and execution history of the queries. As usual, I used Kerry‘s dplan.sql and awr_plan_change.sql to get plan content and execution information.

1. SQL_ID 0dqgq52qf68ag
SELECT ATTR_NO, ATTR_NAME, ATTR_TYPE_NAME, ATTR_TYPE_OWNER FROM
USER_TYPE_ATTRS WHERE TYPE_NAME = :1 ORDER BY ATTR_NO

2. SQL_ID g6wmnb1uq3hnh
begin :1 := dbms_pickler.get_type_shape(:2,:3,:4,:5,:6,:7); end;

3. SQL_ID bunvx480ynf57
SELECT 1 FROM DUAL

4. SQL_ID fcfpwturkq7dm
SELECT ELEM_TYPE_NAME, ELEM_TYPE_OWNER FROM USER_COLL_TYPES WHERE
TYPE_NAME = :1

4_sql_exec_history

Among these queries, pay more attention to SQL bunvx480ynf57 in red above. I remembered when I run my check out logon activities scripts at around 2:30pm on March 1, there was 15,000 logon for the past 15 minutes. The above screenshot of SQL execution history shows the total number of execution of SQL bunvx480ynf57 is around 28,000 executions in a 30 minute snapshot window for the same time period. So it seems there is a strong correlation between this query and frequent logon activity. To verify my assumption, I recheck the total logon/logoff activities between 2pm and 3pm today on Mar 2.

col os_username for a15
col username for a18
col userhost for a15
col avg_sess_cpu for 99,999
col total for 999,999

select os_username, username, userhost, action_name action, count(*)
from dba_audit_trail
where timestamp between to_timestamp( '2016-03-02 14:00', 'yyyy-mm-dd hh24:mi') and to_timestamp( '2016-03-02 15:00', 'yyyy-mm-dd hh24:mi') 
having count(*) > 100
group by  os_username, username, userhost, action_name
order by os_username, username, userhost;

Here is the result:
5_session_snapshot_for_1hr

Yes, my assumption is right. There are 43,600 (34,000 + 9,600) logon/logoff between 2pm and 3pm on Mar 2 while the total number of execution of SQL bunvx480ynf57 during the same timeframe is 19,000 + 26,000 = 45,000. These two numbers are very close.

Based on this finding, I would say the main purpose of this frequent session logon/logoff thing is related to SQL bunvx480ynf57, or SELECT 1 FROM DUAL. For SELECT 1 FROM DUAL query, it is usually used at application layer to keep session alive if the session is idle for too long and avoid session to time out. In addition, the action for LOGOFF is For LOGOFF BY CLEANUP, it usually means the connection on client-side vanishes without a clean disconnect. It’s the client-process that “dies abruptly” and then database PMON process cleans up these abandoned connections. Therefore, it seems to me that this keep alive logic does not work as expected at application layer. Anyway, this is a purely an application design or configuration issue.

Additional Note:
My client’s DBA, Rick, also brought up another nice point about the possibility of this issue at application layer: another common use for ‘SELECT 1 FROM DUAL;’ is to ‘test’ connections. However this model is falling out of favor. The combination of the excessively high login/logout rate and the most frequent sql listed could be caused by improper connection pooling config OR usage. Example of bad usage would be issuing an explicit CLOSE() in the code instead of a RELEASE_CONNECTION() or something better.

Here is the Oracle document about this topic:
Use Test Connections on Reserve with Care

When Test Connections on Reserve is enabled, the server instance checks a database connection prior to returning the connection to a client. This helps reduce the risk of passing invalid connections to clients.

However, it is a fairly expensive operation. Typically, a server instance performs the test by executing a full-fledged SQL query with each connection prior to returning it. If the SQL query fails, the connection is destroyed and a new one is created in its place. A new and optional performance tunable has been provided in WebLogic Server 9.x within this “test connection on reserve” feature. The new optional performance tunable in 9.x allows WebLogic Server to skip this SQL-query test within a configured time window of a prior successful client use (default is 10 seconds). When a connection is returned to the pool by a client, the connection is timestamped by WebLogic Server. WebLogic Server will then skip the SQL-query test if this particular connection is returned to a client within the time window. Once the time window expires, WebLogic Server will execute the SQL-query test. This feature can provide significant performance boosts for busy systems using “test connection on reserve”.

Thanks Rick for sharing his knowledge in WebLogic Server.

PGA_AGGREGATE_TARGET vs PGA_AGGREGATE_LIMIT

Before Oracle 12c, PGA_AGGREGATE_TARGET is the most useful parameter to control PGA memory allocated to work areas. However PGA_AGGREGATE_TARGET is a soft target and not a hard limit. The actual PGA usage can be as high as three times of the value of PGA_AGGREGATE_TARGET. Excessive PGA usage can lead to memory swapping issue and have impact on the performance. There are many articles and blogs discussing this parameter and tuning technique and I will not repeat more here in this blog. Instead I am going to discuss more about a new PGA related parameter PGA_AGGREGATE_LIMIT.

PGA_AGGREGATE_LIMIT is a new parameter introduced in 12c. It put a hard limit instead of a soft limit on the PGA memory usage. It just like we need to put a limit to the height of skyscraper and some of them are away too high. If this limit is reached or exceeded, Oracle will terminates the sessions that are consuming the most untunable PGA memory. I have more detail discussion about tunable and untunable PGA memory at the end of this blog.

skyscraper_over_cloud

Recently I was requested to help my client to investigate a PGA memory related production issue and it was all related to PGA_AGGREGATE_TARGET, PGA_AGGREGATE_LIMIT and user application.

Background
The database is a small 12c database with not much activities. The PGA_AGGREGATE_TARGET is set to 2GB and it is usually sufficient as PGA Cache Hit Ratio hits almost 100% based on the result from v$pga_target_advice.
pga_issue_image_1_advice

When the production issue happened, the user job failed in completion and Oracle alert log file has many PGA related errors:
Errors in file /db/oracle/diag/rdbms/dp783/DP783/trace/DP783_ora_13351.trc (incident=68575):
ORA-04036: PGA memory used by the instance exceeds PGA_AGGREGATE_LIMIT
….
Errors in file /db/oracle/diag/rdbms/dp783/DP783/trace/DP783_ora_28611.trc (incident=68279):
ORA-04030: out of process memory when trying to allocate 16328 bytes (koh-kghu call ,pmuccst: adt/record)
Incident details in: /db/oracle/diag/rdbms/dp783/DP783/incident/incdir_68279/DP783_ora_28611_i68279.trc
Use ADRCI or Support Workbench to package the incident.
See Note 411.1 at My Oracle Support for error and packaging details.
Errors in file /db/oracle/diag/rdbms/dp783/DP783/trace/DP783_ora_28611.trc (incident=68280):
ORA-04030: out of process memory when trying to allocate 169040 bytes (pga heap,kgh stack)
ORA-04030: out of process memory when trying to allocate 16328 bytes (koh-kghu call ,pmuccst: adt/record)

PGA_AGGREGATE_LIMIT parameter was not set at that time. So it took a default value that was dynamically set by the system. By default, Oracle uses the following 3 ways to find out greater of three values and use it as the limit.
1. 2 GB
2. Two times of PGA_AGGREGATE_TARGET parameter , 2 GB x 2 = 4 GB in our case.
3. The value of PROCESS parameter * 3MB. The PROCESS is 300, so the value is 3MB x 300 = 900 MB.
Therefore the actual limit was 4 GB for PGA_AGGREGATE_LIMIT parameter by default. Less than one week before the incident, I requested the execution of edb360 and execution result was indeed confirmed the PGA_AGGREGATE_LIMIT parameter was 4GB.

Obviously, we have a situation with PGA_AGGREGATE_LIMIT reached. As always, client’s next question would be: Does this issue happen before? Which application or process triggered this issue?

Does this issue happen before?
To answer the question whether this issue happened before, I used one query from Carlos Sierra‘s edb360 and modified the code a little bit to allow me to capture the PGA allocation and usage for the past 60 days.

WITH
pgastat_denorm_1 AS (
SELECT /*+ MATERIALIZE NO_MERGE */
       snap_id,
       dbid,
       instance_number,
       SUM(CASE name WHEN 'PGA memory freed back to OS'           THEN value ELSE 0 END) pga_mem_freed_to_os,
       SUM(CASE name WHEN 'aggregate PGA auto target'             THEN value ELSE 0 END) aggr_pga_auto_target,
       SUM(CASE name WHEN 'aggregate PGA target parameter'        THEN value ELSE 0 END) aggr_pga_target_param,
       SUM(CASE name WHEN 'bytes processed'                       THEN value ELSE 0 END) bytes_processed,
       SUM(CASE name WHEN 'extra bytes read/written'              THEN value ELSE 0 END) extra_bytes_rw,
       SUM(CASE name WHEN 'global memory bound'                   THEN value ELSE 0 END) global_memory_bound,
       SUM(CASE name WHEN 'maximum PGA allocated'                 THEN value ELSE 0 END) max_pga_allocated,
       SUM(CASE name WHEN 'maximum PGA used for auto workareas'   THEN value ELSE 0 END) max_pga_used_aut_wa,
       SUM(CASE name WHEN 'maximum PGA used for manual workareas' THEN value ELSE 0 END) max_pga_used_man_wa,
       SUM(CASE name WHEN 'total PGA allocated'                   THEN value ELSE 0 END) tot_pga_allocated,
       SUM(CASE name WHEN 'total PGA inuse'                       THEN value ELSE 0 END) tot_pga_inuse,
       SUM(CASE name WHEN 'total PGA used for auto workareas'     THEN value ELSE 0 END) tot_pga_used_aut_wa,
       SUM(CASE name WHEN 'total PGA used for manual workareas'   THEN value ELSE 0 END) tot_pga_used_man_wa,
       SUM(CASE name WHEN 'total freeable PGA memory'             THEN value ELSE 0 END) tot_freeable_pga_mem
  FROM dba_hist_pgastat
 WHERE name IN
('PGA memory freed back to OS'
,'aggregate PGA auto target'
,'aggregate PGA target parameter'
,'bytes processed'
,'extra bytes read/written'
,'global memory bound'
,'maximum PGA allocated'
,'maximum PGA used for auto workareas'
,'maximum PGA used for manual workareas'
,'total PGA allocated'
,'total PGA inuse'
,'total PGA used for auto workareas'
,'total PGA used for manual workareas'
,'total freeable PGA memory'
)
   AND snap_id in (select snap_id from dba_hist_snapshot where begin_interval_time > sysdate -60)
 GROUP BY
       snap_id,
       dbid,
       instance_number
),
pgastat_denorm_2 AS (
SELECT /*+ MATERIALIZE NO_MERGE */
       h.dbid,
       h.instance_number,
       s.startup_time,
       MIN(h.pga_mem_freed_to_os) pga_mem_freed_to_os,
       MIN(h.bytes_processed) bytes_processed,
       MIN(h.extra_bytes_rw) extra_bytes_rw
  FROM pgastat_denorm_1 h,
       dba_hist_snapshot s
 WHERE s.snap_id = h.snap_id
   AND s.dbid = h.dbid
   AND s.instance_number = h.instance_number
 GROUP BY
       h.dbid,
       h.instance_number,
       s.startup_time
),
pgastat_delta AS (
SELECT /*+ MATERIALIZE NO_MERGE */
       h1.snap_id,
       h1.dbid,
       h1.instance_number,
       s1.begin_interval_time,
       s1.end_interval_time,
       ROUND((CAST(s1.end_interval_time AS DATE) - CAST(s1.begin_interval_time AS DATE)) * 24 * 60 * 60) interval_secs,
       (h1.pga_mem_freed_to_os - h0.pga_mem_freed_to_os) pga_mem_freed_to_os,
       h1.aggr_pga_auto_target,
       h1.aggr_pga_target_param,
       (h1.bytes_processed - h0.bytes_processed) bytes_processed,
       (h1.extra_bytes_rw - h0.extra_bytes_rw) extra_bytes_rw,
       h1.global_memory_bound,
       h1.max_pga_allocated,
       h1.max_pga_used_aut_wa,
       h1.max_pga_used_man_wa,
       h1.tot_pga_allocated,
       h1.tot_pga_inuse,
       h1.tot_pga_used_aut_wa,
       h1.tot_pga_used_man_wa,
       h1.tot_freeable_pga_mem
  FROM pgastat_denorm_1 h0,
       pgastat_denorm_1 h1,
       dba_hist_snapshot s0,
       dba_hist_snapshot s1,
       pgastat_denorm_2 min /* to see cumulative use (replace h0 with min on select list above) */
 WHERE h1.snap_id = h0.snap_id + 1
   AND h1.dbid = h0.dbid
   AND h1.instance_number = h0.instance_number
   AND s0.snap_id = h0.snap_id
   AND s0.dbid = h0.dbid
   AND s0.instance_number = h0.instance_number
   AND s1.snap_id = h1.snap_id
   AND s1.dbid = h1.dbid
   AND s1.instance_number = h1.instance_number
   AND s1.snap_id = s0.snap_id + 1
   AND s1.startup_time = s0.startup_time
   AND s1.begin_interval_time > (s0.begin_interval_time + (1 / (24 * 60))) /* filter out snaps apart < 1 min */
   AND min.dbid = s1.dbid
   AND min.instance_number = s1.instance_number
   AND min.startup_time = s1.startup_time
)
SELECT snap_id,
       TO_CHAR(MIN(begin_interval_time), 'YYYY-MM-DD HH24:MI') begin_time,
       TO_CHAR(MIN(end_interval_time), 'YYYY-MM-DD HH24:MI') end_time,
       ROUND(SUM(pga_mem_freed_to_os) / POWER(2, 30), 3) pga_mem_freed_to_os,
       ROUND(SUM(aggr_pga_auto_target) / POWER(2, 30), 3) aggr_pga_auto_target,
       ROUND(SUM(aggr_pga_target_param) / POWER(2, 30), 3) aggr_pga_target_param,
       ROUND(SUM(bytes_processed) / POWER(2, 30), 3) bytes_processed,
       ROUND(SUM(extra_bytes_rw) / POWER(2, 30), 3) extra_bytes_rw,
       ROUND(SUM(global_memory_bound) / POWER(2, 30), 3) global_memory_bound,
       ROUND(SUM(max_pga_allocated) / POWER(2, 30), 3) max_pga_allocated,
       ROUND(SUM(max_pga_used_aut_wa) / POWER(2, 30), 3) max_pga_used_aut_wa,
       ROUND(SUM(max_pga_used_man_wa) / POWER(2, 30), 3) max_pga_used_man_wa,
       ROUND(SUM(tot_pga_allocated) / POWER(2, 30), 3) tot_pga_allocated,
       ROUND(SUM(tot_pga_inuse) / POWER(2, 30), 3) tot_pga_inuse,
       ROUND(SUM(tot_pga_used_aut_wa) / POWER(2, 30), 3) tot_pga_used_aut_wa,
       ROUND(SUM(tot_pga_used_man_wa) / POWER(2, 30), 3) tot_pga_used_man_wa,
       ROUND(SUM(tot_freeable_pga_mem) / POWER(2, 30), 3) tot_freeable_pga_mem,
       0 dummy_15
  FROM pgastat_delta
 GROUP BY
       snap_id
 ORDER BY
       snap_id;

Captured and imported the result into Excel spreadsheet. Then I created the following two charts showing PGA allocation and usage for the past 60 days and 7 days.
pga_issue_image_2_60dayUsage
pga_issue_image_3_7dayUsage

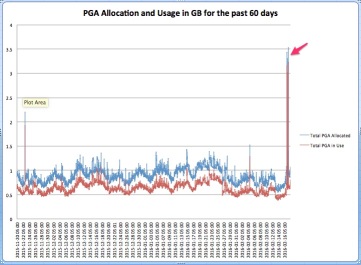
The 60 day chart shows there is no event of PGA limit reached until the date of the incident and the majority of the PGA allocation/usage is between 1 GB and 1.5 GB. At the date of the incident, it had the spike to 3.5 GB. As the data is pulled from the snapshot and has average down effect, so the value is 3.5 GB instead of 4 GB. But that’s good enough. 7 Days chart shows the same issue happened twice at the same date of the incident.

Which application or process triggered this issue?
Ok, let me find out who is the guilty one. I pulled PGA usage information from historical active session history (dba_hist_active_sess_history) and sorted by PGA usage in descending order. Not surprisingly SQL ID cmdzs9ud02bdb is the only SQL that has PGA usage > 1G and there are 605 occurrences. We can also see the top occurrences were around 4GB, reaching to the limit of PGA_AGGREGATE_LIMIT parameter. Pay more attention to XMLTABLE EVALUATION. If not careful, anything related to XML can cause a lot of performance headache.

pga_issue_image_4_topQuery
pga_issue_image_5_topQueryTotal
Is this SQL a new SQL or an old SQL?
For a query with performance issue, The first thing I usually check is to use Kerry‘s awr_plan_change script to find out the SQL history and performance.

set lines 155
col execs for 999,999,999
col avg_etime for 999,999.999
col avg_lio for 9,999,999,999.9
col avg_pio for 9,999,999,999.9
col begin_interval_time for a30
col node for 99999
break on plan_hash_value on startup_time skip 1
select ss.snap_id, ss.instance_number node, begin_interval_time, sql_id, plan_hash_value,
nvl(executions_delta,0) execs,
(elapsed_time_delta/decode(nvl(executions_delta,0),0,1,executions_delta))/1000000 avg_etime,
(buffer_gets_delta/decode(nvl(executions_delta,0),0,1,executions_delta)) avg_lio,
(disk_reads_delta/decode(nvl(executions_delta,0),0,1,executions_delta)) avg_pio,
rows_processed_delta total_rows
from DBA_HIST_SQLSTAT S, DBA_HIST_SNAPSHOT SS
where sql_id = nvl('&sql_id','4dqs2k5tynk61')
and ss.snap_id = S.snap_id
and ss.instance_number = S.instance_number
and s.instance_number like nvl('&instance_number',s.instance_number)
order by 1, 2, 3
/

pga_issue_image_6_totalRow

The result from awr_plan_change shows this is an old SQL that had executions as early as 6 months ago. The query cmdzs9ud02bdb performed good until Feb. 16 and Feb. 17 was date that had this performance issue. Looking closely, there is no plan change and the key difference between these good runs and bad runs is the the total number of rows returned. Good runs usually return a few thousand rows at most while the bad run on Feb. 17 returned 11 million rows before blowing out the PGA memory. PL/SQL and XML are untunable PGA memory and no wonder Oracle decided to kill this SQL first. I have no insight information about this query from application side. But purely from database perspective, it doesn’t seem to be a good practice for this query to return 11 million rows of result to application layer. Interestingly, the next day the query performed normally and returned just a few thousand rows. Coincidentally, there was a production application upgrade just the night before the incident and I do not know whether it was related or not. Anyway, I believe this is an application issue instead of database issue.

A few other side notes:
1. To monitor the limit is reached or not, Oracle uses CKPT process to checks the limit every 3 seconds. If the limit is reached or exceeded, then CKPT terminates calls for the sessions using the most untunable PGA memory.

Tunable PGA memory refers to the part of PGA memory that is allocated for SQL activities like sorts, hash-join, group-by, bitmap merge and bitmap index create. This part of memory can be shrinked or expanded based on the system load. Untunable PGA memory refers to other part of the PGA memory that can not be shrinked, such as PL/SQL, Java, context information for each session or for each open/active cursor. The size of tunable memory can be found from “aggregate PGA auto target”. Make sure aggregate PGA auto target should not be too small compared with the value of PGA_AGGREGATE_TARGET because we want to have enough PGA Memory left for workareas. The ‘maximum PGA used for auto workareas‘ gives the maximum reached by previous statistic since instance startup.

col NAME for a40
SELECT NAME, VALUE, UNIT FROM V$PGASTAT 
where
NAME in ( 'aggregate PGA target parameter', 'aggregate PGA auto target', 'total PGA inuse ', 
'total PGA allocated', 'maximum PGA used for auto workareas', 'cache hit percentage', 'over allocation count');

NAME                                          VALUE UNIT
---------------------------------------- ---------- ------------
aggregate PGA target parameter           2147483648 bytes
aggregate PGA auto target                1428175872 bytes
total PGA allocated                       816254976 bytes
maximum PGA used for auto workareas      2305454080 bytes
over allocation count                          1924
cache hit percentage                          97.36 percent

If untunable PGA memory + minimum tunable memory required to execute the work area workload > PGA_AGGREGATE_TARGET, over-allocating PGA memory can happen and extra PGA memory allocation beyond PGA_AGGREGATE_TARGET occurs. We can see this number from over allocation count and you want this number as small as possible.

To find out current active workarea, we can use the following query:

col sid for 99999 
col operation for a20
col start_time for a20
col expected_size_MB for 99,999.9 
col Act_Used_MB for 99,999.9 
col Max_Used_MB for 99,999.9
col TEMP_Seg_MB for 999,999
select to_char(sql_exec_start, 'yyyy-mm-dd hh24:mi:ss') start_time, sql_id,
       to_number(decode(sid, 65535, NULL, sid)) sid,
       operation_type operation, trunc(expected_size/1024/1024) expected_size_MB,
       trunc(actual_mem_used/1024/1024) Act_Used_MB, trunc(max_mem_used/1024/1204) Max_Used_MB,
       number_passes pass, trunc(tempseg_size/1024/1024) TEMP_Seg_MB
FROM v$sql_workarea_active
ORDER BY 1,2;

START_TIME           SQL_ID           SID OPERATION            EXPECTED_SIZE_MB ACT_USED_MB MAX_USED_MB       PASS TEMP_SEG_MB
-------------------- ------------- ------ -------------------- ---------------- ----------- ----------- ---------- -----------
2016-02-23 02:45:53  ff0vxztrvduhw    169 SORT (v2)                         3.0         3.0         3.0          0
2016-02-23 09:37:19  77zanb2q2bcxc    435 GROUP BY (SORT)                    .0          .0          .0          0
2016-02-23 16:43:48  2x8yy828hjmn5    451 HASH-JOIN                         5.0          .0          .0          0
2016-02-23 16:43:48  2x8yy828hjmn5    340 HASH-JOIN                         5.0          .0          .0          0
2016-02-23 16:43:48  4a1x3rvduurnr     91 HASH-JOIN                         4.0          .0          .0          0

As CKPT process checks the limit in 3 second interval, it is possible for PGA memory usage to briefly exceed PGA_AGGREGATE_LIMIT and return back to the level below limit.

2. According to Oracle Doc Limiting process size with database parameter PGA_AGGREGATE_LIMIT (1520324.1), there is no difference in behavior between PGA_AGGREGATE_LIMIT being explicitly set or being set to the default. Because the parameter responds to changing memory conditions, you do not need to set the parameter value explicitly. The document also states: If a value of 0 is specified, it means there is no limit to the aggregate PGA memory consumed by the instance. I believe this statement doesn’t mean we could use unlimited memory in PGA, but just consider this PGA_AGGREGATE_LIMIT not exists anymore and 3xPGA_AGGREGATE_TARGET is the limit for PGA usage.

SQL Tuning beyond the Execution Plan

Recently my client asked me to help one development team to find out why one query performed badly for the past few weeks.

The query is a simple update SQL statement with the sqlid of 1am0d1r44m7sx.

UPDATE MYDB_STAGING
SET IS_PROCESSED = 'R',
NM_MODIFIED ='MYDB_VERSIONING'
WHERE DT_COB =:B1
AND IS_LATEST =0
AND IS_PROCESSED = 'N'

Check out the AWR plan and found out two plans associated with this SQL.

SQL> @dplan_awr
Enter value for sql_id: 1am0d1r44m7sx
Enter value for plan_hash_value:

PLAN_TABLE_OUTPUT
------------------------------------------------------------------------------------------------------------------------------------------------------------------------------------
SQL_ID 1am0d1r44m7sx
--------------------
UPDATE MYDB_STAGING SET IS_PROCESSED = 'R', NM_MODIFIED
='MYDB_VERSIONING' WHERE DT_COB=:B1 AND IS_LATEST=0 AND IS_PROCESSED =
'N'

Plan hash value: 1281386787
-------------------------------------------------------------------------------------------------------------------------------
| Id  | Operation                           | Name                    | Rows  | Bytes | Cost (%CPU)| Time     | Pstart| Pstop |
-------------------------------------------------------------------------------------------------------------------------------
|   0 | UPDATE STATEMENT                    |                         |       |       |  2398 (100)|          |       |       |
|   1 |  UPDATE                             | MYDB_STAGING            |       |       |            |          |       |       |
|   2 |   PARTITION RANGE SINGLE            |                         |    26 |  1742 |  2398   (1)| 00:00:29 |   KEY |   KEY |
|   3 |    TABLE ACCESS BY LOCAL INDEX ROWID| MYDB_STAGING            |    26 |  1742 |  2398   (1)| 00:00:29 |   KEY |   KEY |
|   4 |     INDEX RANGE SCAN                | ACTIVE_MKT_DATA_STG_IDX |   104K|       |  2398   (1)| 00:00:29 |   KEY |   KEY |
-------------------------------------------------------------------------------------------------------------------------------
Peeked Binds (identified by position):
--------------------------------------
   1 - :B1 (DATE): 09/12/2014 00:00:00

SQL_ID 1am0d1r44m7sx
--------------------
UPDATE MYDB_STAGING SET IS_PROCESSED = 'R', NM_MODIFIED
='MYDB_VERSIONING' WHERE DT_COB=:B1 AND IS_LATEST=0 AND IS_PROCESSED =
'N'

Plan hash value: 1961169265
------------------------------------------------------------------------------------------------------------
| Id  | Operation               | Name             | Rows  | Bytes | Cost (%CPU)| Time     | Pstart| Pstop |
------------------------------------------------------------------------------------------------------------
|   0 | UPDATE STATEMENT        |                  |       |       |    25 (100)|          |       |       |
|   1 |  UPDATE                 | MYDB_STAGING     |       |       |            |          |       |       |
|   2 |   PARTITION RANGE SINGLE|                  |  1392 | 22272 |    25   (0)| 00:00:01 |   KEY |   KEY |
|   3 |    TABLE ACCESS FULL    | MYDB_STAGING     |  1392 | 22272 |    25   (0)| 00:00:01 |   KEY |   KEY |
------------------------------------------------------------------------------------------------------------
Peeked Binds (identified by position):
--------------------------------------
   1 - :B1 (DATE): 03/13/2015 00:00:00

Next I checked out some basic information about the table.

SQL> @dba_tables
Enter value for owner: MDDBO
Enter value for table_name: MYDB_STAGING

OWNER   TABLE_NAME    STATUS LAST_ANALYZED  NUM_ROWS   BLOCKS    DEGREE PAR
------- ------------- ------ -------------- ---------- --------- ------ ---
MDDBO   MYDB_STAGING  VALID  13-JUN-15      117989022  11234944       1 YES

The table is a partition table and table size is not big, about 120 million rows. Each partition contains 3~7 million rows. According to the user, each execution usually updates 2~3 million rows. Run the following query to get the partition key for the table. It’s DT_COB column.

SQL> select column_name, column_position from dba_part_key_columns
where owner='MDDBO' and name='MYDB_STAGING';  

COLUMN_NAME     COLUMN_POSITION
--------------- ---------------
DT_COB                        1

Based on the above information, the correct access path needs to use single partition full scan, in other words, should use plan 1961169265 instead of plan 1281386787. As I saw many cases of query plan flipped in the past, at first, I thought this could be another example of typical plan changes. Run the query to verify my assumption:

SQL> @awr_plan_change
Enter value for sql_id: 1am0d1r44m7sx
Enter value for instance_number:

   SNAP_ID   NODE BEGIN_INTERVAL_TIME            SQL_ID        PLAN_HASH_VALUE        EXECS    AVG_ETIME          AVG_LIO          AVG_PIO
---------- ------ ------------------------------ ------------- --------------- ------------ ------------ ---------------- ----------------
     97353      2 06-MAY-15 07.23.37.548 PM      1am0d1r44m7sx      1961169265            1      118.175      3,531,575.0        270,839.0
     97377      7 07-MAY-15 07.00.24.645 PM      1am0d1r44m7sx                            1    2,660.042      3,820,002.0        341,582.0
     97401      3 08-MAY-15 07.00.04.204 PM      1am0d1r44m7sx                            0    3,573.805      7,998,068.0        980,442.0
     97473      1 11-MAY-15 07.00.12.432 PM      1am0d1r44m7sx                            1      576.099      3,639,026.0        286,946.0
     97497      5 12-MAY-15 07.00.08.174 PM      1am0d1r44m7sx                            1    1,729.939      4,261,057.0        340,114.0
     97521      1 13-MAY-15 07.00.02.560 PM      1am0d1r44m7sx                            1    1,898.494      4,266,891.0        364,785.0
     97545      1 14-MAY-15 07.00.03.598 PM      1am0d1r44m7sx                            1      718.034      3,439,714.0        270,765.0
     97569      1 15-MAY-15 07.00.00.695 PM      1am0d1r44m7sx                            1      829.346      3,731,965.0        284,365.0
     97641      6 18-MAY-15 07.00.04.875 PM      1am0d1r44m7sx                            1      888.942      4,903,243.0        399,901.0
     97665      5 19-MAY-15 07.00.05.411 PM      1am0d1r44m7sx                            1      581.278      3,515,619.0        268,340.0
     97689      6 20-MAY-15 07.00.02.358 PM      1am0d1r44m7sx                            1    1,053.530      3,957,242.0        314,391.0
     97713      8 21-MAY-15 07.00.17.748 PM      1am0d1r44m7sx                            1    3,103.021      5,442,853.0        558,322.0
     97738      1 22-MAY-15 07.00.02.100 PM      1am0d1r44m7sx                            1      723.603      3,640,845.0        285,694.0
     97810      1 25-MAY-15 07.00.01.961 PM      1am0d1r44m7sx                            1      366.762      2,275,088.0        173,936.0
     97834      2 26-MAY-15 07.00.04.461 PM      1am0d1r44m7sx                            0    3,611.451      2,160,988.0        252,119.0
     97835      2 26-MAY-15 08.00.14.555 PM      1am0d1r44m7sx                            0    3,543.604     12,876,728.0      2,320,402.0
     97858      6 27-MAY-15 07.00.09.103 PM      1am0d1r44m7sx                            0    3,589.634      9,592,036.0      1,268,348.0
     97882      8 28-MAY-15 07.00.10.821 PM      1am0d1r44m7sx                            0    3,580.830      6,042,271.0        689,048.0
     97883      8 28-MAY-15 08.00.03.331 PM      1am0d1r44m7sx                            1    1,584.714     17,450,422.0      1,564,930.0
     97906      2 29-MAY-15 07.00.02.462 PM      1am0d1r44m7sx                            0    3,577.977      3,861,047.0        528,738.0
     97978      4 01-JUN-15 07.00.01.451 PM      1am0d1r44m7sx                            0    3,578.352      8,051,298.0        817,057.0
     97979      4 01-JUN-15 08.00.05.179 PM      1am0d1r44m7sx                            1      165.220      2,695,013.0        274,682.0
     98002      3 02-JUN-15 07.00.05.820 PM      1am0d1r44m7sx                            0    3,515.592      6,794,546.0        726,537.0
     98026      7 03-JUN-15 07.00.01.053 PM      1am0d1r44m7sx                            0    3,581.938     11,215,112.0      1,790,826.0
     98027      7 03-JUN-15 08.00.13.693 PM      1am0d1r44m7sx                            1    2,573.582     14,189,836.0      2,530,507.0
     98050      1 04-JUN-15 07.00.04.722 PM      1am0d1r44m7sx                            0    3,572.691      5,255,766.0        736,876.0
     98051      1 04-JUN-15 08.00.06.604 PM      1am0d1r44m7sx                            1    1,801.395     10,407,772.0      2,162,490.0
     98074      7 05-JUN-15 07.00.05.143 PM      1am0d1r44m7sx                            0    3,566.342      3,585,895.0        405,328.0
     98075      7 05-JUN-15 08.00.00.392 PM      1am0d1r44m7sx                            0    3,591.525     30,546,458.0      3,151,443.0
     98076      7 05-JUN-15 09.00.07.352 PM      1am0d1r44m7sx                            1    1,492.171     19,251,729.0      1,558,493.0
     98146      3 08-JUN-15 07.00.01.496 PM      1am0d1r44m7sx                            0    3,530.138      9,209,187.0        652,218.0
     98170      7 09-JUN-15 07.00.02.540 PM      1am0d1r44m7sx                            0    3,538.753      5,187,425.0        481,987.0
     98171      7 09-JUN-15 08.00.08.762 PM      1am0d1r44m7sx                            1      996.519      9,047,047.0        802,864.0
     98194      6 10-JUN-15 07.00.07.800 PM      1am0d1r44m7sx                            0    3,577.875      5,266,386.0        408,865.0
     98195      6 10-JUN-15 08.00.04.068 PM      1am0d1r44m7sx                            0    3,572.545      9,247,723.0      2,239,318.0
     98196      6 10-JUN-15 09.00.02.624 PM      1am0d1r44m7sx                            0    3,493.045     11,131,196.0      4,195,213.0
     98197      6 10-JUN-15 10.00.16.671 PM      1am0d1r44m7sx                            0    3,662.746     18,616,721.0      4,365,932.0
     98198      6 10-JUN-15 11.00.13.227 PM      1am0d1r44m7sx                            0    3,610.344     21,346,638.0      5,733,209.0
     98199      6 11-JUN-15 12.00.08.600 AM      1am0d1r44m7sx                            0    3,648.539      8,701,577.0      2,714,068.0
     98200      6 11-JUN-15 01.00.11.149 AM      1am0d1r44m7sx                            0    3,519.821     17,616,343.0      4,880,834.0
     98201      6 11-JUN-15 02.00.03.849 AM      1am0d1r44m7sx                            0    3,634.058     18,767,326.0      4,584,485.0
     98202      6 11-JUN-15 03.00.03.191 AM      1am0d1r44m7sx                            0    3,596.024     14,784,489.0      4,191,209.0
     98203      6 11-JUN-15 04.00.06.450 AM      1am0d1r44m7sx                            0    3,573.926     17,111,846.0      5,648,559.0
     98204      6 11-JUN-15 05.00.10.709 AM      1am0d1r44m7sx                            0    3,649.037     16,125,390.0      4,559,875.0
     98205      6 11-JUN-15 06.00.02.222 AM      1am0d1r44m7sx                            0    3,627.405     23,724,739.0      5,026,544.0
     98206      6 11-JUN-15 07.00.03.859 AM      1am0d1r44m7sx                            0    3,584.408     22,462,507.0      5,036,174.0
     98207      6 11-JUN-15 08.00.02.770 AM      1am0d1r44m7sx                            0    3,499.634     21,113,112.0      5,622,234.0
     98208      6 11-JUN-15 09.00.07.852 AM      1am0d1r44m7sx                            0    3,622.151     19,325,484.0      8,609,591.0
48 rows selected.

Checked out the plan and it was indeed doing the full scan on one single partition. Interestingly, there was no plan change and the plan was indeed using hash value 1961169265. The query result shows the majority of execution time was below 3,000 seconds before May 25th. After May 25th, the query consistently took more than a few hours, in the worst cases, days without finishing. Both logical IO and physical IO after May 25th are 4~8 times higher than normal period before May 25th.

Client confirmed there is no data volume change during this period. So the sudden data volume jump is ruled out. Thing became interesting here.

My next suspicion is whether there are other DML activities against the same table. Client said yes and there is always insert and delete activities against this table. But the same DML activities also happened before May 25th, why the performance is different right now. Fair statement. Quickly wrote a query sql_text_info.sql and used it to search all SQLs against this table.

 
SQL> @sql_text_info
Enter value for sql_text: %MYDB_STAGING%

interval time    INST SQL_ID         HASH_VALUE      EXECS      ETIME   AVG_ETIME           LIO        AVG_LIO SQL_TEXT
---------------- ---- ------------- ----------- ---------- ---------- ----------- ------------- -------------- ------------------------------------
. . . .
jun-02-15 01:00     5 1j601hg74p2qh                  1,657   95.29188        .058     14,762616        8,909.2 INSERT INTO MDDBO.MYDB_STAGING(S
jun-01-15 21:00     2 1j601hg74p2qh                    988 110.640511        .112     15,292134       15,477.9 INSERT INTO MDDBO.MYDB_STAGING(S
jun-01-15 21:00     2 bgvcuszpxp1x9                    988 110.996902        .112     15,304010       15,489.9 DECLARE V_NM_SUPPLY   VARCHAR2 (400)
jun-01-15 20:00     4 buwna1hmvy2a0  2175852021          1 153.140902     153.141      1,825674    1,825,674.0 UPDATE MYDB_STAGING SET IS_LATES
jun-01-15 20:00     4 1am0d1r44m7sx  1961169265          1 165.219891     165.220      2,695013    2,695,013.0 UPDATE MYDB_STAGING SET IS_PROCE
jun-01-15 19:00     5 bgvcuszpxp1x9           0     11,308 186.595527        .017      1,845134          163.2 DECLARE V_NM_SUPPLY   VARCHAR2 (400)
jun-01-15 19:00     5 1j601hg74p2qh                 11,309 183.916696        .016      1,709844          151.2 INSERT INTO MDDBO.MYDB_STAGING(S
jun-01-15 19:00     2 1j601hg74p2qh                  9,494 210.490704        .022      8,176275          861.2 INSERT INTO MDDBO.MYDB_STAGING(S
jun-01-15 19:00     2 bgvcuszpxp1x9                  9,491 212.032152        .022      8,289925          873.5 DECLARE V_NM_SUPPLY   VARCHAR2 (400)
jun-01-15 16:00     8 1j601hg74p2qh                  2,843 123.610869        .043     20,252536        7,123.6 INSERT INTO MDDBO.MYDB_STAGING(S
jun-01-15 16:00     1 1j601hg74p2qh                  5,990 211.389932        .035     31,781333        5,305.7 INSERT INTO MDDBO.MYDB_STAGING(S
jun-01-15 16:00     8 bgvcuszpxp1x9                  2,838   123.9323        .044     20,155222        7,101.9 DECLARE V_NM_SUPPLY   VARCHAR2 (400)
jun-01-15 16:00     1 bgvcuszpxp1x9                  5,981 212.434201        .036     31,765722        5,311.1 DECLARE V_NM_SUPPLY   VARCHAR2 (400)
. . . .
may-25-15 22:00     7 1j601hg74p2qh                  1,498 105.318346        .070     17,110206       11,422.0 INSERT INTO MDDBO.MYDB_STAGING(S
may-25-15 22:00     8 1j601hg74p2qh                    500  51.938971        .104      8,436275       16,872.6 INSERT INTO MDDBO.MYDB_STAGING(S
may-25-15 22:00     8 bgvcuszpxp1x9                    500  52.122208        .104      8,442285       16,884.6 DECLARE V_NM_SUPPLY   VARCHAR2 (400)
may-25-15 22:00     4 1j601hg74p2qh                  1,000  96.772358        .097     16,339154       16,339.2 INSERT INTO MDDBO.MYDB_STAGING(S
may-25-15 22:00     4 bgvcuszpxp1x9                    994  96.550291        .097     16,243633       16,341.7 DECLARE V_NM_SUPPLY   VARCHAR2 (400)
may-25-15 22:00     6 bgvcuszpxp1x9                    505  52.105969        .103      8,401898       16,637.4 DECLARE V_NM_SUPPLY   VARCHAR2 (400)
may-25-15 22:00     6 1j601hg74p2qh                    505  51.917207        .103      8,395818       16,625.4 INSERT INTO MDDBO.MYDB_STAGING(S
may-25-15 19:00     1 1am0d1r44m7sx  1961169265          1 366.762256     366.762      2,275088    2,275,088.0 UPDATE MYDB_STAGING SET IS_PROCE
may-25-15 13:00     6 bgvcuszpxp1x9           0     33,406  1444.6719        .043    256,909395        7,690.5 DECLARE V_NM_SUPPLY   VARCHAR2 (400)
may-25-15 13:00     6 1j601hg74p2qh                 33,476 1439.05292        .043    258,297516        7,715.9 INSERT INTO MDDBO.MYDB_STAGING(S
may-25-15 13:00     3 bgvcuszpxp1x9                 48,792 2208.19674        .045    387,805213        7,948.1 DECLARE V_NM_SUPPLY   VARCHAR2 (400)
may-25-15 13:00     3 1j601hg74p2qh                 48,917 2205.34858        .045    389,636787        7,965.3 INSERT INTO MDDBO.MYDB_STAGING(S
may-25-15 13:00     7 1j601hg74p2qh                 36,201 1801.23233        .050    321,210434        8,873.0 INSERT INTO MDDBO.MYDB_STAGING(S
may-25-15 13:00     7 bgvcuszpxp1x9                 36,155 1807.59592        .050    320,840251        8,874.0 DECLARE V_NM_SUPPLY   VARCHAR2 (400)
may-25-15 13:00     2 1j601hg74p2qh                 37,718 1763.97237        .047    288,696415        7,654.1 INSERT INTO MDDBO.MYDB_STAGING(S
may-25-15 13:00     2 bgvcuszpxp1x9                 37,675 1770.14259        .047    288,827077        7,666.3 DECLARE V_NM_SUPPLY   VARCHAR2 (400)
may-25-15 13:00     4 1j601hg74p2qh                 32,156 1490.11108        .046    260,436584        8,099.2 INSERT INTO MDDBO.MYDB_STAGING(S
. . .  .
may-15-15 21:00     6 bgvcuszpxp1x9                 11,282 312.503981        .028     46,699981        4,139.3 DECLARE V_NM_SUPPLY   VARCHAR2 (400)
may-15-15 21:00     1 1j601hg74p2qh                 26,218 849.230019        .032    131,299020        5,008.0 INSERT INTO MDDBO.MYDB_STAGING(S
may-15-15 21:00     1 bgvcuszpxp1x9                 26,131 857.433845        .033    131,200097        5,020.9 DECLARE V_NM_SUPPLY   VARCHAR2 (400)
may-15-15 21:00     2 bgvcuszpxp1x9                 14,772 386.170741        .026     58,074157        3,931.4 DECLARE V_NM_SUPPLY   VARCHAR2 (400)
may-15-15 21:00     4 bgvcuszpxp1x9                 11,474 350.669289        .031     55,183416        4,809.4 DECLARE V_NM_SUPPLY   VARCHAR2 (400)
may-15-15 21:00     4 1j601hg74p2qh                 11,489 348.176292        .030     55,437597        4,825.3 INSERT INTO MDDBO.MYDB_STAGING(S
may-15-15 21:00     2 1j601hg74p2qh                 14,815 383.870156        .026     58,137060        3,924.2 INSERT INTO MDDBO.MYDB_STAGING(S
may-15-15 21:00     3 bgvcuszpxp1x9                 17,502 512.293434        .029     79,491976        4,541.9 DECLARE V_NM_SUPPLY   VARCHAR2 (400)
may-15-15 21:00     3 1j601hg74p2qh                 17,517  506.51756        .029     79,329693        4,528.7 INSERT INTO MDDBO.MYDB_STAGING(S
may-15-15 21:00     8 bgvcuszpxp1x9                  8,593 273.929099        .032     44,014364        5,122.1 DECLARE V_NM_SUPPLY   VARCHAR2 (400)
may-15-15 21:00     8 1j601hg74p2qh                  8,601 271.977545        .032     44,284047        5,148.7 INSERT INTO MDDBO.MYDB_STAGING(S
may-15-15 19:00     1 1am0d1r44m7sx  1961169265          1 829.346177     829.346      3,731965    3,731,965.0 UPDATE MYDB_STAGING SET IS_PROCE
may-15-15 17:00     3 bgvcuszpxp1x9           0     13,998 154.832559        .011     12,076269          862.7 DECLARE V_NM_SUPPLY   VARCHAR2 (400)
may-15-15 17:00     3 1j601hg74p2qh                  5,999  86.716744        .014      5,305216          884.4 INSERT INTO MDDBO.MYDB_STAGING(S
may-15-15 14:00     8 bgvcuszpxp1x9                  7,772 208.118833        .027     34,702132        4,465.0 DECLARE V_NM_SUPPLY   VARCHAR2 (400)
may-15-15 14:00     8 1j601hg74p2qh                  7,804 207.315633        .027     35,442987        4,541.6 INSERT INTO MDDBO.MYDB_STAGING(S
may-15-15 14:00     2 bgvcuszpxp1x9                  6,948 231.212222        .033     36,165505        5,205.2 DECLARE V_NM_SUPPLY   VARCHAR2 (400)
may-15-15 14:00     2 1j601hg74p2qh                  6,968 229.081633        .033     35,870516        5,147.9 INSERT INTO MDDBO.MYDB_STAGING(S
may-15-15 14:00     4 1j601hg74p2qh                  8,067 207.975898        .026     35,897394        4,449.9 INSERT INTO MDDBO.MYDB_STAGING(S
may-15-15 14:00     4 bgvcuszpxp1x9                  8,038 209.069809        .026     35,470064        4,412.8 DECLARE V_NM_SUPPLY   VARCHAR2 (400)
may-15-15 14:00     5 bgvcuszpxp1x9                  5,010 146.873536        .029     23,838187        4,758.1 DECLARE V_NM_SUPPLY   VARCHAR2 (400)
may-15-15 14:00     5 1j601hg74p2qh                  5,025 146.944746        .029     23,908322        4,757.9 INSERT INTO MDDBO.MYDB_STAGING(S
may-15-15 14:00     6 bgvcuszpxp1x9                  7,462 217.030479        .029     35,107121        4,704.8 DECLARE V_NM_SUPPLY   VARCHAR2 (400)

As I expected, since May 25th, it did have some insert activities during the same time period between 7pm and 8pm. So I recommended them to kill the current update query, just rerun it during the time when low or no insert activity. Unsurprisingly, the query completed within the same timeframe it usually completed. Case closed. To find out the scripts used in this blog, check them out on Scripts.

For the past two months, I have some other interesting activities.
1) Both Randy and I helped our client, one of the largest banks in the world, to successfully migrate their Oracle database to Exadata platform. It was the largest oracle database migration in the bank history and involved many development teams and operation teams. It was one of the most challenge project I have ever done. Hardly slept for the first week. Almost totally exhausted after the system was stabilized. Glad the database is performing well on Exadata right now.
2) I attended our E4 event early June. I have been to every E4 event since the event was launched three years ago. The event becomes bigger and bigger, and this year is the first time under Accenture brand. It is a great event for meeting so many top database experts and chatting with friends and colleagues.
3) Finally, I joined Accenture team in New York and run JP Morgan Chase Corporate Challenge event at Central Park with other 20,000 runners on June 4th. It was fun 5K run and I really enjoy the run. If I am still around New York same time next year, I am definitely going to participate the event again.

Here are some photos from the activities.
Celebration after the Success of the Migration
IMG_1101

The First Day at E4 2015
IMG_1091

My Run at JP Morgan Chase Corporate Challenge
JPMC_CC_2015_WeidongZhou